Motorola 2010 Annual Report Download - page 46
Download and view the complete annual report
Please find page 46 of the 2010 Motorola annual report below. You can navigate through the pages in the report by either clicking on the pages listed below, or by using the keyword search tool below to find specific information within the annual report.-
 1
1 -
2
-
3
-
4
-
5
-
6
-
7
-
8
-
9
-
10
-
11
-
12
-
13
-
14
-
15
-
16
-
17
-
18
-
19
-
20
-
21
-
22
-
23
-
24
-
25
-
26
-
27
-
28
-
29
-
30
-
31
-
32
-
33
-
34
-
35
-
 36
36 -
 37
37 -
 38
38 -
 39
39 -
 40
40 -
 41
41 -
 42
42 -
 43
43 -
 44
44 -
 45
45 -
 46
46 -
 47
47 -
 48
48 -
 49
49 -
 50
50 -
 51
51 -
 52
52 -
 53
53 -
 54
54 -
 55
55 -
 56
56 -
57
-
58
-
59
-
60
-
61
-
62
-
63
-
64
-
65
-
66
-
67
-
68
-
69
-
70
-
71
-
72
-
73
-
74
-
75
-
76
-
77
-
78
-
79
-
80
-
81
-
82
-
83
-
84
-
85
-
86
-
87
-
88
-
89
-
90
-
91
-
92
-
93
-
94
-
95
-
96
-
97
-
98
-
99
-
100
-
101
-
102
-
103
-
104
-
105
-
106
-
107
-
108
-
109
-
110
-
111
-
112
-
113
-
114
-
115
-
116
-
117
-
118
-
119
-
120
-
121
-
122
-
123
-
124
-
125
-
126
-
127
-
128
-
129
-
130
-
131
-
132
-
133
-
134
-
135
-
136
-
137
-
138
-
139
-
140
-
141
-
142
-
143
-
144
 |
 |

38
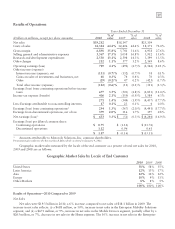
Mobility Solutions segment reflects a 19% increase in net sales to the commercial enterprise market and a 5%
increase in net sales to the government and public safety market. The 9% increase in net revenues in the Mobile
Devices segment was primarily driven by a 61% increase in average selling price (“ASP”), partially offset by a 32%
decrease in unit shipments. The 7% decrease in net revenues in the Home segment reflects a 12% decrease in net
revenues from set-top boxes, partially offset by higher net revenues from video and access infrastructure equipment.
Gross Margin
Gross margin was $6.9 billion, or 35.8% of net sales, in 2010, compared to $5.7 billion, or 31.6% of net sales,
in 2009. The increase in gross margin reflects: (i) a significant increase in the Mobile Devices segment, and
(ii) increases in the Enterprise Mobility Solutions and Home segments. The increase in gross margin in the Mobile
Devices segment was primarily driven by: (i) a favorable product mix, specifically due to increased volume of
smartphone devices, (ii) lower excess inventory and other related charges in 2010 than in 2009, and (iii) the 9%
increase in net sales. The increase in gross margin in the Enterprise Mobility Solutions segment was primarily driven
by the 10% increase in net sales and a favorable product mix. The increase in gross margin in the Home segment
was due to a favorable product margin mix across all product lines.
The increase in gross margin as a percentage of net sales in 2010 compared to 2009 reflects an increase in gross
margin percentage in all segments. The Company’s overall gross margin as a percentage of net sales is impacted by
the proportion of overall net sales generated by its various businesses.
Selling, General and Administrative Expenses
Selling, general and administrative (“SG&A”) expenses increased 10% to $3.4 billion, or 17.5% of net sales, in
2010, compared to $3.1 billion, or 16.8% of net sales, in 2009. The increase in SG&A expenses reflects higher
SG&A expenses in all segments, reflecting higher incentive, pension and other benefit expenses across the Company,
as well as the segment-specific drivers that follow. The increase in the Enterprise Mobility Solutions segment was
primarily due to increased selling and marketing expenses related to the increase in net sales. The increase in the
Mobile Devices segment was primarily driven by an increase in marketing expenses. The slight increase in the Home
segment was primarily due to a non-recurring charge to settle a legal matter. SG&A expenses as a percentage of net
sales increased in all segments.
Research and Development Expenditures
Research and development (“R&D”) expenditures decreased 3% to $2.5 billion, or 13.1% of net sales, in
2010, compared to $2.6 billion, or 14.3% of net sales, in 2009. The decrease in R&D expenditures reflects lower
R&D expenditures in the Mobile Devices and Home segments, partially offset by increased R&D expenditures in
the Enterprise Mobility Solutions segment. The decreases in R&D expenditures in the Mobile Devices and Home
segments are primarily due to savings from cost-reduction initiatives. The increase in R&D expenditures in the
Enterprise Mobility Solutions segment was primarily due to developmental engineering expenditures for new
product development and investment in next-generation technologies.
R&D expenditures as a percentage of net sales decreased in all segments. The Company participates in very
competitive industries with constant changes in technology and, accordingly, the Company continues to believe that
a strong commitment to R&D is required to drive long-term growth.
Other Charges
The Company recorded net charges of $212 million in Other charges in 2010, compared to net charges of
$577 million in 2009. The charges in 2010 included: (i) $258 million of charges relating to the amortization of
intangibles, (ii) $242 million of separation-related transaction costs, and (iii) $100 million of net reorganization of
business charges included in Other charges, partially offset by $388 million of gains related to legal settlements and
intellectual property reserve adjustments. The charges in 2009 included: (i) $277 million of charges relating to the
amortization of intangibles, (ii) $235 million of net reorganization of business charges included in Other charges,
(iii) $23 million of charges related to an environmental reserve, and (iv) $42 million of separation-related
transaction costs.