Motorola 2010 Annual Report Download - page 60
Download and view the complete annual report
Please find page 60 of the 2010 Motorola annual report below. You can navigate through the pages in the report by either clicking on the pages listed below, or by using the keyword search tool below to find specific information within the annual report.-
 1
1 -
2
-
3
-
4
-
5
-
6
-
7
-
8
-
9
-
10
-
11
-
12
-
13
-
14
-
15
-
16
-
17
-
18
-
19
-
20
-
21
-
22
-
23
-
24
-
25
-
26
-
27
-
28
-
29
-
30
-
31
-
32
-
33
-
34
-
35
-
36
-
37
-
38
-
39
-
40
-
41
-
42
-
43
-
44
-
45
-
46
-
47
-
48
-
49
-
 50
50 -
 51
51 -
 52
52 -
 53
53 -
 54
54 -
 55
55 -
 56
56 -
 57
57 -
 58
58 -
 59
59 -
 60
60 -
 61
61 -
 62
62 -
 63
63 -
 64
64 -
 65
65 -
 66
66 -
 67
67 -
 68
68 -
 69
69 -
 70
70 -
71
-
72
-
73
-
74
-
75
-
76
-
77
-
78
-
79
-
80
-
81
-
82
-
83
-
84
-
85
-
86
-
87
-
88
-
89
-
90
-
91
-
92
-
93
-
94
-
95
-
96
-
97
-
98
-
99
-
100
-
101
-
102
-
103
-
104
-
105
-
106
-
107
-
108
-
109
-
110
-
111
-
112
-
113
-
114
-
115
-
116
-
117
-
118
-
119
-
120
-
121
-
122
-
123
-
124
-
125
-
126
-
127
-
128
-
129
-
130
-
131
-
132
-
133
-
134
-
135
-
136
-
137
-
138
-
139
-
140
-
141
-
142
-
143
-
144
 |
 |

52
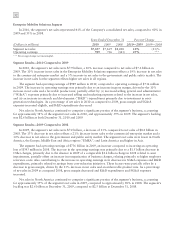
Enterprise Mobility Solutions Segment
In 2010, the segment’s net sales represented 41% of the Company’s consolidated net sales, compared to 40% in
2009 and 33% in 2008.
Years Ended December 31 Percent Change
(Dollars in millions) 2010 2009 2008 2010—2009 2009—2008
Segment net sales $7,857 $7,169 $8,228 10% (13)%
Operating earnings 949 736 (343) 29% ***
*** Percentage change not meaningful.
Segment Results—2010 Compared to 2009
In 2010, the segment’s net sales were $7.9 billion, a 10% increase compared to net sales of $7.2 billion in
2009. The 10% increase in net sales in the Enterprise Mobility Solutions segment reflects a 19% increase in net sales
to the commercial enterprise market and a 5% increase in net sales to the government and public safety market. The
increase in net sales for the segment reflects higher net sales in all regions.
The segment had operating earnings of $949 million in 2010, compared to operating earnings of $736 million
in 2009. The increase in operating earnings was primarily due to an increase in gross margin, driven by the 10%
increase in net sales and a favorable product mix, partially offset by: (i) increased selling, general and administrative
(“SG&A”) expenses primarily due to increased selling and marketing expenses related to the increase in net sales,
and (ii) an increase in research and development (“R&D”) expenditures primarily due to investment in next-
generation technologies. As a percentage of net sales in 2010 as compared to 2009, gross margin and SG&A
expenses increased slightly, and R&D expenditures decreased.
Net sales in North America continued to comprise a significant portion of the segment’s business, accounting
for approximately 58% of the segment’s net sales in 2010, and approximately 59% in 2009. The segment’s backlog
was $2.6 billion at both December 31, 2010 and 2009.
Segment Results—2009 Compared to 2008
In 2009, the segment’s net sales were $7.2 billion, a decrease of 13% compared to net sales of $8.2 billion in
2008. The 13% decrease in net sales reflects a 21% decrease in net sales to the commercial enterprise market and a
10% decrease in net sales to the government and public safety market. The segment’s net sales were lower in North
America, the Europe, Middle East and Africa region (“EMEA”) and Latin America and higher in Asia.
The segment had operating earnings of $736 billion in 2009, an increase compared to incurring an operating
loss of $343 million in 2008. The increase in the operating earnings was primarily due to a $1.5 billion decrease in
Other charges, primarily due to the absence in 2009 of a comparable $1.6 billion charge in 2008 related to asset
impairments, partially offset an increase in reorganization of business charges, relating primarily to higher employee
severance costs. Also contributing to the increase in operating earnings were decreases in SG&A expenses and R&D
expenditures, primarily related to savings from cost-reduction initiatives. These factors were partially offset by a
decrease in gross margin, driven by the 13% decrease in net sales and an unfavorable product mix. As a percentage
of net sales in 2009 as compared 2008, gross margin decreased and R&D expenditures and SG&A expenses
increased.
Net sales in North America continued to comprise a significant portion of the segment’s business, accounting
for approximately 59% of the segment’s net sales in 2009, compared to approximately 58% in 2008. The segment’s
backlog was $2.6 billion at December 31, 2009, compared to $2.5 billion at December 31, 2008.