Motorola 2010 Annual Report Download - page 112
Download and view the complete annual report
Please find page 112 of the 2010 Motorola annual report below. You can navigate through the pages in the report by either clicking on the pages listed below, or by using the keyword search tool below to find specific information within the annual report.-
 1
1 -
2
-
3
-
4
-
5
-
6
-
7
-
8
-
9
-
10
-
11
-
12
-
13
-
14
-
15
-
16
-
17
-
18
-
19
-
20
-
21
-
22
-
23
-
24
-
25
-
26
-
27
-
28
-
29
-
30
-
31
-
32
-
33
-
34
-
35
-
36
-
37
-
38
-
39
-
40
-
41
-
42
-
43
-
44
-
45
-
46
-
47
-
48
-
49
-
50
-
51
-
52
-
53
-
54
-
55
-
56
-
57
-
58
-
59
-
60
-
61
-
62
-
63
-
64
-
65
-
66
-
67
-
68
-
69
-
70
-
71
-
72
-
73
-
74
-
75
-
76
-
77
-
78
-
79
-
80
-
81
-
82
-
83
-
84
-
85
-
86
-
87
-
88
-
89
-
90
-
91
-
92
-
93
-
94
-
95
-
96
-
97
-
98
-
99
-
100
-
101
-
 102
102 -
 103
103 -
 104
104 -
 105
105 -
 106
106 -
 107
107 -
 108
108 -
 109
109 -
 110
110 -
 111
111 -
 112
112 -
 113
113 -
 114
114 -
 115
115 -
 116
116 -
 117
117 -
 118
118 -
 119
119 -
 120
120 -
 121
121 -
 122
122 -
123
-
124
-
125
-
126
-
127
-
128
-
129
-
130
-
131
-
132
-
133
-
134
-
135
-
136
-
137
-
138
-
139
-
140
-
141
-
142
-
143
-
144
 |
 |

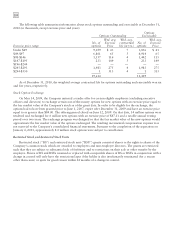
104
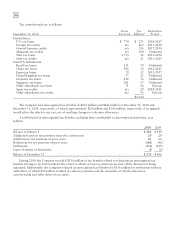
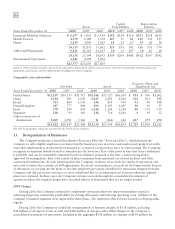
The following table summarizes information about stock options outstanding and exercisable at December 31,
2010 (in thousands, except exercise price and years):
Options Outstanding
Options
Exercisable
Exercise price range
No. of
options
Wtd. avg.
Exercise
Price
Wtd. avg.
contractual
life (in yrs.)
No. of
options
Wtd. avg.
Exercise
Price
Under $49 9,059 $ 43 7 3,856 $ 41
$49-$97 6,801 65 5 4,914 65
$98-$146 1,537 116 4 1,442 115
$147-$195 233 149 5 233 149
$196-$244 — — — — —
$245-$293 1,983 275 4 1,983 275
$294-$330 1 313 4 1 313
19,614 12,429
As of December 31, 2010, the weighted average contractual life for options outstanding and exercisable was six
and five years, respectively.
Stock Option Exchange
On May 14, 2009, the Company initiated a tender offer for certain eligible employees (excluding executive
officers and directors) to exchange certain out-of-the-money options for new options with an exercise price equal to
the fair market value of the Company’s stock as of the grant date. In order to be eligible for the exchange, the
options had to have been granted prior to June 1, 2007, expire after December 31, 2009 and have an exercise price
equal to or greater than $84.00. The offering period closed on June 12, 2009. On that date, 14 million options were
tendered and exchanged for 6 million new options with an exercise price of $47.11 and a ratable annual vesting
period over two years. The exchange program was designed so that the fair market value of the new options would
approximate the fair market value of the options exchanged. The resulting incremental compensation expense was
not material to the Company’s consolidated financial statements. Pursuant to the completion of the separation on
January 4, 2011, approximately 8.0 million stock options were subject to cancellation.
Restricted Stock and Restricted Stock Units
Restricted stock (“RS”) and restricted stock unit (“RSU”) grants consist of shares or the rights to shares of the
Company’s common stock which are awarded to employees and non-employee directors. The grants are restricted
such that they are subject to substantial risk of forfeiture and to restrictions on their sale or other transfer by the
employee. Shares of RS and RSUs assumed or replaced with comparable shares of RS or RSUs in conjunction with a
change in control will only have the restrictions lapse if the holder is also involuntarily terminated (for a reason
other than cause) or quits for good reason within 24 months of a change in control.