Motorola 2010 Annual Report Download - page 61
Download and view the complete annual report
Please find page 61 of the 2010 Motorola annual report below. You can navigate through the pages in the report by either clicking on the pages listed below, or by using the keyword search tool below to find specific information within the annual report.-
 1
1 -
2
-
3
-
4
-
5
-
6
-
7
-
8
-
9
-
10
-
11
-
12
-
13
-
14
-
15
-
16
-
17
-
18
-
19
-
20
-
21
-
22
-
23
-
24
-
25
-
26
-
27
-
28
-
29
-
30
-
31
-
32
-
33
-
34
-
35
-
36
-
37
-
38
-
39
-
40
-
41
-
42
-
43
-
44
-
45
-
46
-
47
-
48
-
49
-
50
-
 51
51 -
 52
52 -
 53
53 -
 54
54 -
 55
55 -
 56
56 -
 57
57 -
 58
58 -
 59
59 -
 60
60 -
 61
61 -
 62
62 -
 63
63 -
 64
64 -
 65
65 -
 66
66 -
 67
67 -
 68
68 -
 69
69 -
 70
70 -
 71
71 -
72
-
73
-
74
-
75
-
76
-
77
-
78
-
79
-
80
-
81
-
82
-
83
-
84
-
85
-
86
-
87
-
88
-
89
-
90
-
91
-
92
-
93
-
94
-
95
-
96
-
97
-
98
-
99
-
100
-
101
-
102
-
103
-
104
-
105
-
106
-
107
-
108
-
109
-
110
-
111
-
112
-
113
-
114
-
115
-
116
-
117
-
118
-
119
-
120
-
121
-
122
-
123
-
124
-
125
-
126
-
127
-
128
-
129
-
130
-
131
-
132
-
133
-
134
-
135
-
136
-
137
-
138
-
139
-
140
-
141
-
142
-
143
-
144
 |
 |

53
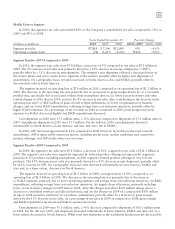
Mobile Devices Segment
In 2010, the segment’s net sales represented 40% of the Company’s consolidated net sales, compared to 39% in
2009 and 48% in 2008.
Years Ended December 31 Percent Change
(Dollars in millions) 2010 2009 2008 2010—2009 2009—2008
Segment net sales $7,819 $ 7,146 $12,099 9% (41)%
Operating earnings (loss) (76) (1,215) (2,432) (94)% (50)%
Segment Results—2010 Compared to 2009
In 2010, the segment’s net sales were $7.8 billion, an increase of 9% compared to net sales of $7.1 billion in
2009. The 9% increase in net sales was primarily driven by a 61% increase in average selling price (“ASP”),
partially offset by a 32% decrease in unit shipments. The segment’s unit shipments reflected a decreased focus on
the feature phone and voice-centric device segments of the market, partially offset by higher unit shipments of
smartphones. On a geographic basis, net sales increased in North America, Asia and EMEA, partially offset by
decreased net sales in Latin America.
The segment incurred an operating loss of $76 million in 2010, compared to an operating loss of $1.2 billion in
2009. The decrease in the operating loss was primarily due to an increase in gross margin driven by: (i) a favorable
product mix, specifically due to increased volume from smartphone devices, (ii) lower excess inventory and other
related charges in 2010 than in 2009, and (iii) the 9% increase in net sales. Also contributing to the decrease in the
operating loss were: (i) $283 million of gains related to legal settlements, (ii) lower reorganization of business
charges, and (iii) lower R&D expenditures, reflecting savings from cost-reduction initiatives, partially offset by
higher SG&A expenses. As a percentage of net revenues in 2010 as compared to 2009, gross margin increased,
expenses for SG&A decreased slightly and R&D expenditures decreased.
Unit shipments in 2010 were 37.3 million units, a 32% decrease compared to shipments of 55.1 million units in
2009. Smartphone shipments in 2010 were 13.7 million. For the full year 2010, unit shipments decreased
substantially in North America, Latin America and Asia and, were flat in EMEA.
In 2010, ASP increased approximately 61% compared to 2009 driven by favorable product mix towards
smartphones. ASP is impacted by numerous factors, including product mix, market conditions and competitive
product offerings, and ASP trends often vary over time.
Segment Results—2009 Compared to 2008
In 2009, the segment’s net sales were $7.1 billion, a decrease of 41% compared to net sales of $12.1 billion in
2008. The segment’s net sales were negatively impacted by reduced product offerings in large market segments,
particularly 3G products, including smartphones, and the segment’s limited product offerings in very low-tier
products. The 41% decrease in net sales was primarily driven by a 45% decrease in unit shipments, partially offset
by an 8% increase in ASP. On a geographic basis, net sales decreased substantially in Latin America, EMEA and
Asia and, to a lesser extent, decreased in North America.
The segment incurred an operating loss of $1.2 billion in 2009, an improvement of 50% compared to an
operating loss of $2.4 billion in 2008. The decrease in the operating loss was primarily due to decreases in:
(i) SG&A expenses, primarily due to lower marketing expenses and savings from cost-reduction initiatives, (ii) R&D
expenditures, reflecting savings from cost-reduction initiatives, (iii) supply chain efficiencies, primarily including
lower excess inventory charges in 2009 than in 2008, when the charges included a $370 million charge due to a
decision to consolidate software and silicon platforms, and (iv) the absence in 2009 of a comparable $150 million
charge in 2008 related to settlement of a purchase commitment, partially offset by a decrease in gross margin,
driven by the 41% decrease in net sales. As a percentage of net sales in 2009 as compared to 2008, gross margin
and R&D expenditures increased and SG&A expenses decreased.
Unit shipments in 2009 were 55.1 million units, a 45% decrease compared to shipments of 100.1 million units
in 2008. For the full year 2009, unit shipments decreased substantially in Latin America, EMEA and Asia and, to a
lesser extent, decreased in North America. While total unit shipments in the worldwide handset market decreased by