Motorola 2010 Annual Report Download - page 126
Download and view the complete annual report
Please find page 126 of the 2010 Motorola annual report below. You can navigate through the pages in the report by either clicking on the pages listed below, or by using the keyword search tool below to find specific information within the annual report.-
 1
1 -
2
-
3
-
4
-
5
-
6
-
7
-
8
-
9
-
10
-
11
-
12
-
13
-
14
-
15
-
16
-
17
-
18
-
19
-
20
-
21
-
22
-
23
-
24
-
25
-
26
-
27
-
28
-
29
-
30
-
31
-
32
-
33
-
34
-
35
-
36
-
37
-
38
-
39
-
40
-
41
-
42
-
43
-
44
-
45
-
46
-
47
-
48
-
49
-
50
-
51
-
52
-
53
-
54
-
55
-
56
-
57
-
58
-
59
-
60
-
61
-
62
-
63
-
64
-
65
-
66
-
67
-
68
-
69
-
70
-
71
-
72
-
73
-
74
-
75
-
76
-
77
-
78
-
79
-
80
-
81
-
82
-
83
-
84
-
85
-
86
-
87
-
88
-
89
-
90
-
91
-
92
-
93
-
94
-
95
-
96
-
97
-
98
-
99
-
100
-
101
-
102
-
103
-
104
-
105
-
106
-
107
-
108
-
109
-
110
-
111
-
112
-
113
-
114
-
115
-
 116
116 -
 117
117 -
 118
118 -
 119
119 -
 120
120 -
 121
121 -
 122
122 -
 123
123 -
 124
124 -
 125
125 -
 126
126 -
 127
127 -
 128
128 -
 129
129 -
 130
130 -
 131
131 -
 132
132 -
 133
133 -
 134
134 -
 135
135 -
 136
136 -
137
-
138
-
139
-
140
-
141
-
142
-
143
-
144
 |
 |
118
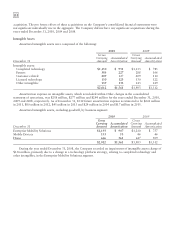
acquisition. The pro forma effects of these acquisitions on the Company’s consolidated financial statements were
not significant individually nor in the aggregate. The Company did not have any significant acquisitions during the
years ended December 31, 2010, 2009 and 2008.
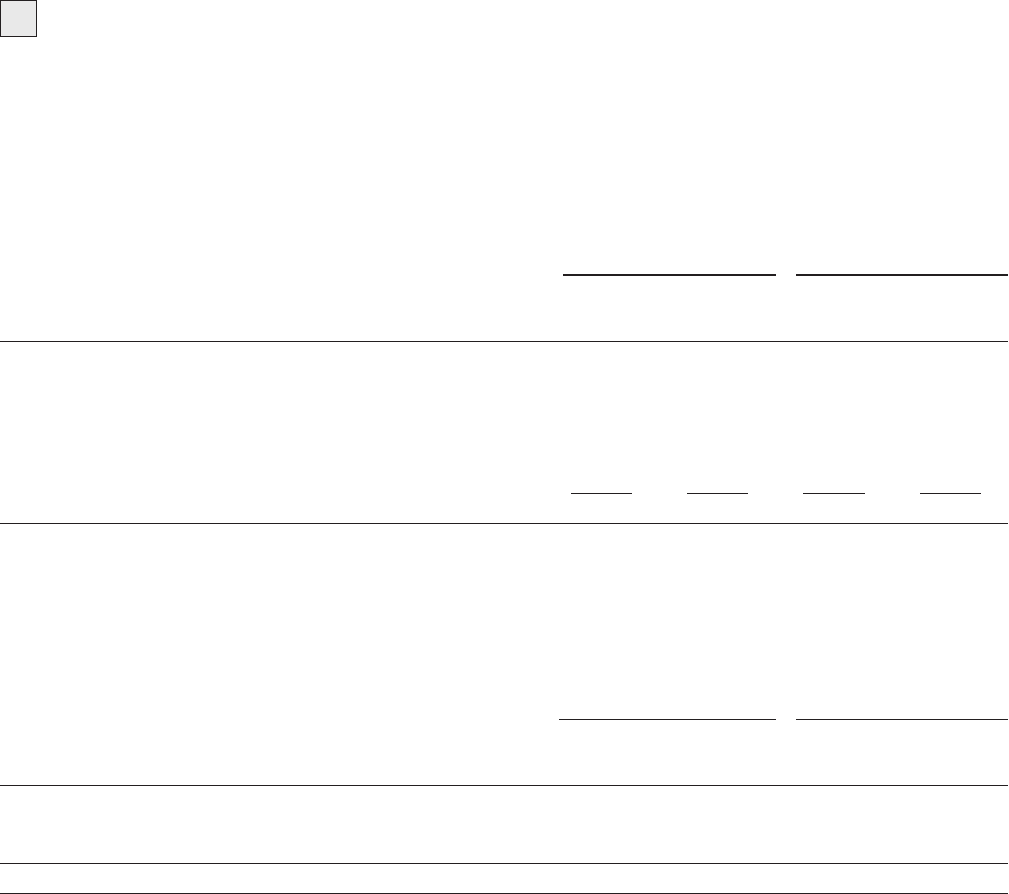
Intangible Assets
Amortized intangible assets were comprised of the following:
2010 2009
December 31
Gross
Carrying
Amount
Accumulated
Amortization
Gross
Carrying
Amount
Accumulated
Amortization
Intangible assets:
Completed technology $1,150 $ 951 $1,133 $ 785
Patents 384 227 288 166
Customer-related 209 127 209 110
Licensed technology 130 123 130 122
Other intangibles 139 133 143 129
$2,012 $1,561 $1,903 $1,312
Amortization expense on intangible assets, which is included within Other charges in the consolidated
statement of operations, was $258 million, $277 million and $294 million for the years ended December 31, 2010,
2009 and 2008, respectively. As of December 31, 2010 future amortization expense is estimated to be $241 million
in 2011, $80 million in 2012, $45 million in 2013 and $24 million in 2014 and $17 million in 2015.
Amortized intangible assets, excluding goodwill, by business segment:
2010 2009
December 31
Gross
Carrying
Amount Accumulated
Amortization
Gross
Carrying
Amount
Accumulated
Amortization
Enterprise Mobility Solutions $1,193 $ 947 $1,210 $ 757
Mobile Devices 153 53 46 46
Home 666 561 647 509
$2,012 $1,561 $1,903 $1,312
During the year ended December 31, 2008, the Company recorded an impairment of intangible assets charge of
$136 million, primarily due to a change in a technology platform strategy, relating to completed technology and
other intangibles, in the Enterprise Mobility Solutions segment.