Motorola 2010 Annual Report Download - page 80
Download and view the complete annual report
Please find page 80 of the 2010 Motorola annual report below. You can navigate through the pages in the report by either clicking on the pages listed below, or by using the keyword search tool below to find specific information within the annual report.-
 1
1 -
2
-
3
-
4
-
5
-
6
-
7
-
8
-
9
-
10
-
11
-
12
-
13
-
14
-
15
-
16
-
17
-
18
-
19
-
20
-
21
-
22
-
23
-
24
-
25
-
26
-
27
-
28
-
29
-
30
-
31
-
32
-
33
-
34
-
35
-
36
-
37
-
38
-
39
-
40
-
41
-
42
-
43
-
44
-
45
-
46
-
47
-
48
-
49
-
50
-
51
-
52
-
53
-
54
-
55
-
56
-
57
-
58
-
59
-
60
-
61
-
62
-
63
-
64
-
65
-
66
-
67
-
68
-
69
-
 70
70 -
 71
71 -
 72
72 -
 73
73 -
 74
74 -
 75
75 -
 76
76 -
 77
77 -
 78
78 -
 79
79 -
 80
80 -
 81
81 -
 82
82 -
 83
83 -
 84
84 -
 85
85 -
 86
86 -
 87
87 -
 88
88 -
 89
89 -
 90
90 -
91
-
92
-
93
-
94
-
95
-
96
-
97
-
98
-
99
-
100
-
101
-
102
-
103
-
104
-
105
-
106
-
107
-
108
-
109
-
110
-
111
-
112
-
113
-
114
-
115
-
116
-
117
-
118
-
119
-
120
-
121
-
122
-
123
-
124
-
125
-
126
-
127
-
128
-
129
-
130
-
131
-
132
-
133
-
134
-
135
-
136
-
137
-
138
-
139
-
140
-
141
-
142
-
143
-
144
 |
 |

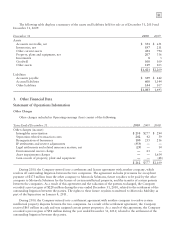
72
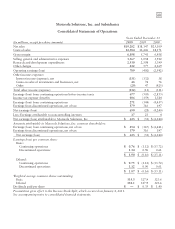
Motorola Solutions, Inc. and Subsidiaries
Consolidated Statements of Cash Flows
Years Ended December 31
(In millions) 2010 2009 2008
Operating
Net earnings (loss) attributable to Motorola Solutions, Inc. $ 633 $ (51) $(4,244)
Earnings attributable to noncontrolling interests 17 23 4
Net earnings (loss) 650 (28) (4,240)
Earnings from discontinued operations 379 316 197
Earnings (loss) from continuing operations 271 (344) (4,437)
Adjustments to reconcile loss from continuing operations to net cash provided by (used for)
operating activities:
Depreciation and amortization 572 642 686
Non-cash other charges (income) (76) (12) 2,619
Share-based compensation expense 273 263 236
Gain on sales of investments and businesses, net (48) (74) (76)
Loss (gain) from extinguishment of long-term debt 12 (67) (14)
Deferred income taxes 346 50 1,698
Changes in assets and liabilities, net of effects of acquisitions and dispositions:
Accounts receivable (311) 91 1,749
Inventories (267) 1,266 (129)
Other current assets 41 510 506
Accounts payable and accrued liabilities 920 (2,412) (1,716)
Other assets and liabilities (199) (8) (1,447)
Net cash provided by (used for) operating activities 1,534 (95) (325)
Investing
Acquisitions and investments, net (170) (38) (282)
Proceeds from sales of investments and businesses, net 276 343 120
Distributions from investments —— 113
Capital expenditures (335) (204) (408)
Proceeds from sales of property, plant and equipment 28 23 130
Proceeds from sales (purchases) of Sigma Fund investments, net 453 (922) 853
Proceeds from sales (purchases) of short-term investments, net (6) 201 395
Net cash provided by (used for) investing activities 246 (597) 921
Financing
Repayment of short-term borrowings, net (5) (86) (50)
Repayment of debt (1,011) (132) (225)
Issuance of common stock 179 116 145
Repurchase of common stock —— (138)
Proceeds from settlement of financial instruments —— 158
Payment of dividends —(114) (453)
Distributions from discontinued operations 383 703 405
Other, net (14) 68
Net cash provided by (used for) financing activities (468) 493 (150)
Net cash provided by operating activities from discontinued operations 433 724 551
Net cash used for investing activities from discontinued operations (58) (71) (201)
Net cash used for financing activities from discontinued operations (383) (703) (405)
Effect of exchange rate changes on cash and cash equivalents from discontinued operations 850 55
Net cash provided by (used for) discontinued operations ———
Effect of exchange rate changes on cash and cash equivalents from continuing operations 27 4 (134)
Net increase (decrease) in cash and cash equivalents 1,339 (195) 312
Cash and cash equivalents, beginning of year 2,869 3,064 2,752
Cash and cash equivalents, end of year $ 4,208 $ 2,869 $ 3,064
Cash Flow Information
Cash paid during the year for:
Interest, net $ 240 $ 320 $ 252
Income taxes, net of refunds 259 159 407
See accompanying notes to consolidated financial statements.