Motorola 2010 Annual Report Download - page 41
Download and view the complete annual report
Please find page 41 of the 2010 Motorola annual report below. You can navigate through the pages in the report by either clicking on the pages listed below, or by using the keyword search tool below to find specific information within the annual report.-
 1
1 -
2
-
3
-
4
-
5
-
6
-
7
-
8
-
9
-
10
-
11
-
12
-
13
-
14
-
15
-
16
-
17
-
18
-
19
-
20
-
21
-
22
-
23
-
24
-
25
-
26
-
27
-
28
-
29
-
30
-
 31
31 -
 32
32 -
 33
33 -
 34
34 -
 35
35 -
 36
36 -
 37
37 -
 38
38 -
 39
39 -
 40
40 -
 41
41 -
 42
42 -
 43
43 -
 44
44 -
 45
45 -
 46
46 -
 47
47 -
 48
48 -
 49
49 -
 50
50 -
 51
51 -
52
-
53
-
54
-
55
-
56
-
57
-
58
-
59
-
60
-
61
-
62
-
63
-
64
-
65
-
66
-
67
-
68
-
69
-
70
-
71
-
72
-
73
-
74
-
75
-
76
-
77
-
78
-
79
-
80
-
81
-
82
-
83
-
84
-
85
-
86
-
87
-
88
-
89
-
90
-
91
-
92
-
93
-
94
-
95
-
96
-
97
-
98
-
99
-
100
-
101
-
102
-
103
-
104
-
105
-
106
-
107
-
108
-
109
-
110
-
111
-
112
-
113
-
114
-
115
-
116
-
117
-
118
-
119
-
120
-
121
-
122
-
123
-
124
-
125
-
126
-
127
-
128
-
129
-
130
-
131
-
132
-
133
-
134
-
135
-
136
-
137
-
138
-
139
-
140
-
141
-
142
-
143
-
144
 |
 |

33
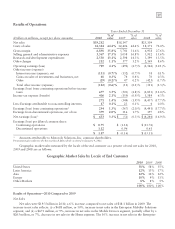
Item 6: Selected Financial Data
Motorola Solutions, Inc. and Subsidiaries
Five-Year Financial Summary
Years Ended December 31
(Dollars in millions, except as noted) 2010 2009 2008 2007 2006
Operating Results
Net sales $19,282 $18,147 $25,109 $31,369 $38,034
Costs of sales 12,384 12,406 18,171 22,938 27,100
Gross margin 6,898 5,741 6,938 8,431 10,934
Selling, general and administrative expenses 3,367 3,058 3,912 4,482 3,922
Research and development expenditures 2,530 2,598 3,399 3,566 3,138
Other charges (income) 212 577 2,169 861 (68)
Operating earnings (loss) 789 (492) (2,542) (478) 3,942
Other income (expense):
Interest income (expense), net (131) (132) 38 71 323
Gains on sales of investments and businesses, net 48 74 76 16 25
Other (29) 47 (425) 35 146
Total other income (expense) (112) (11) (311) 122 494
Earnings (loss) from continuing operations before income
taxes 677 (503) (2,853) (356) 4,436
Income tax expense (benefit) 406 (159) 1,584 (316) 1,336
Earnings (loss) from continuing operations 271 (344) (4,437) (40) 3,100
Earnings from discontinued operations, net of tax 379 316 197 5 570
Net earnings (loss) 650 (28) (4,240) (35) 3,670
Less: Earnings attributable to noncontrolling interests 17 23 4 14 9
Net earnings (loss) attributable to Motorola Solutions, Inc. $ 633 $ (51) $ (4,244) $ (49) $ 3,661
Amounts attributable to Motorola Solutions, Inc. common
shareholders
Earnings (loss) from continuing operations, net of tax $ 254 $ (367) $ (4,441) $ (54) $ 3,091
Earnings from discontinued operations, net of tax 379 316 197 5 570
Net earnings (loss) $ 633 $ (51) $ (4,244) $ (49) $ 3,661
Per Share Data (in dollars)
Diluted earnings (loss) from continuing operations per
common share $ 0.75 $ (1.12) $ (13.72) $ (0.16) $ 8.64
Diluted earnings (loss) per common share 1.87 (0.16) (13.11) (0.15) 10.23
Diluted weighted average common shares outstanding (in
millions) 338.1 327.9 323.6 330.4 357.7
Dividends paid per share $—$ 0.35 $ 1.40 $ 1.40 $ 1.26
Balance Sheet
Total assets $25,577 $25,603 $27,869 $34,812 $38,593
Long-term debt 2,194 3,365 4,092 3,991 2,704
Total debt 2,799 3,901 4,184 4,323 4,397
Total stockholders’ equity 10,987 9,883 9,595 15,525 17,186
Other Data
Capital expenditures $ 335 $ 204 $ 408 $ 413 $ 520
% of sales 1.7% 1.1% 1.6% 1.3% 1.4%
Research and development expenditures $ 2,530 $ 2,598 $ 3,399 $ 3,566 $ 3,138
% of sales 13.1% 14.3% 13.5% 11.4% 8.3%
Year-end employment (in thousands) 51 53 64 66 66
Presentation gives effect to the Reverse Stock Split, which occurred on January 4, 2011.