Motorola 2010 Annual Report Download - page 52
Download and view the complete annual report
Please find page 52 of the 2010 Motorola annual report below. You can navigate through the pages in the report by either clicking on the pages listed below, or by using the keyword search tool below to find specific information within the annual report.-
 1
1 -
2
-
3
-
4
-
5
-
6
-
7
-
8
-
9
-
10
-
11
-
12
-
13
-
14
-
15
-
16
-
17
-
18
-
19
-
20
-
21
-
22
-
23
-
24
-
25
-
26
-
27
-
28
-
29
-
30
-
31
-
32
-
33
-
34
-
35
-
36
-
37
-
38
-
39
-
40
-
41
-
 42
42 -
 43
43 -
 44
44 -
 45
45 -
 46
46 -
 47
47 -
 48
48 -
 49
49 -
 50
50 -
 51
51 -
 52
52 -
 53
53 -
 54
54 -
 55
55 -
 56
56 -
 57
57 -
 58
58 -
 59
59 -
 60
60 -
 61
61 -
 62
62 -
63
-
64
-
65
-
66
-
67
-
68
-
69
-
70
-
71
-
72
-
73
-
74
-
75
-
76
-
77
-
78
-
79
-
80
-
81
-
82
-
83
-
84
-
85
-
86
-
87
-
88
-
89
-
90
-
91
-
92
-
93
-
94
-
95
-
96
-
97
-
98
-
99
-
100
-
101
-
102
-
103
-
104
-
105
-
106
-
107
-
108
-
109
-
110
-
111
-
112
-
113
-
114
-
115
-
116
-
117
-
118
-
119
-
120
-
121
-
122
-
123
-
124
-
125
-
126
-
127
-
128
-
129
-
130
-
131
-
132
-
133
-
134
-
135
-
136
-
137
-
138
-
139
-
140
-
141
-
142
-
143
-
144
 |
 |

44
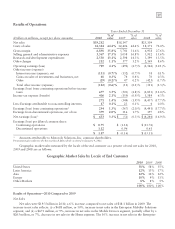
Operating Activities
The cash provided by operating activities from continuing operations in 2010 was $1.5 billion, compared to
$95 million used in 2009, and $325 million used in 2008. The primary contributors to the cash provided in 2010
were: (i) income from continuing operations (adjusted for net non-cash charges) of $1.3 billion, and (ii) a
$920 million increase in accounts payable and accrued liabilities, partially offset by: (i) a $311 million increase in
accounts receivable, and (ii) a $267 million increase in inventories.
Accounts Receivable: The Company’s net accounts receivable were $3.3 billion at December 31, 2010,
compared to $2.8 billion at December 31, 2009. The increase in the Company’s net accounts receivable was driven
by higher net accounts receivable in all segments. The Company’s businesses sell their products in a variety of
markets throughout the world and payment terms can vary by market type and geographic location. Accordingly,
the Company’s levels of net accounts receivable can be impacted by the timing and level of sales that are made by its
various businesses and by the geographic locations in which those sales are made.
As further described below under “Sales of Receivables,” the Company’s levels of net accounts receivable can
also be impacted by the timing and amount of accounts receivable sold to third parties, which can vary by period
and can be impacted by numerous factors.
Inventory: The Company’s net inventory was $1.4 billion at December 31, 2010, compared to $1.1 billion at
December 31, 2009. The increase in the Company’s net inventory was driven by higher net inventory in all
segments. Inventory management continues to be an area of focus as the Company balances the need to maintain
strategic inventory levels to ensure competitive delivery performance to its customers against the risk of inventory
excess and obsolescence due to rapidly changing technology and customer spending requirements.
Accounts Payable: The Company’s accounts payable were $2.5 billion at December 31, 2010, compared to
$2.0 billion at December 31, 2009. The increase in the Company’s accounts payable was driven by higher accounts
payable in all segments. The Company buys products in a variety of markets throughout the world and payment
terms can vary by market type and geographic location. Accordingly, the Company’s levels of accounts payable can
be impacted by the timing and level of purchases made by its various businesses and by the geographic locations in
which those purchases are made.
Benefit Plan Contributions: The Company contributed $157 million to its U.S. pension plans during 2010,
compared to $90 million contributed in 2009. The Company contributed $47 million to its non-U.S. pension plans
during 2010, compared to $39 million contributed in 2009. In January 2011, the Pension Benefit Guaranty
Corporation (“PBGC”) announced an agreement with Motorola Solutions under which the Company will
contribute $100 million above and beyond its legal requirement to its U.S. noncontributory pension plan (“U.S.
Regular Pension Plan”) over the next five years. The Company and the PBGC entered into the agreement as the
Company was in the process of separating Motorola Mobility and pursuing the sale of certain assets of it Networks
business. Also in January 2011, the Company elected the available optional pension contribution relief which
reduced its required 2011 U.S. Regular Pension Plan contribution from approximately $265 million to
approximately $235 million. During 2011, the Company expects to make cash contributions of approximately $240
million to its U.S. pension plans and approximately $40 million to its non-U.S. pension plans. The Company
maintained all of the U.S. pension liabilities and the majority of the non-U.S. pension liabilities following the
Separation of Motorola Mobility on January 4, 2011.
The Company amended its U.S. Regular Pension Plan, the Officers’ Plan and the Motorola Supplemental
Pension Plan such that: (i) no participant shall accrue any benefits or additional benefits on or after March 1, 2009,
and (ii) no compensation increases earned by a participant on or after March 1, 2009 shall be used to compute any
accrued benefit.
The Company made no contributions to its Postretirement Health Care Benefits Plan in either 2010 or 2009,
and expects to make no contributions to this plan in 2011. The Company maintained the entire Postretirement
Health Care Benefits Plan liability following the Separation of Motorola Mobility on January 4, 2011. Retirement
benefits are further discussed below in the “Significant Accounting Policies—Retirement Benefits” section.
Investing Activities
Net cash provided by investing activities was $246 million in 2010, compared to net cash used of $597 million
in 2009 and net cash provided of $921 million in 2008. The $843 million increase in net cash provided by investing