Motorola 2010 Annual Report Download - page 54
Download and view the complete annual report
Please find page 54 of the 2010 Motorola annual report below. You can navigate through the pages in the report by either clicking on the pages listed below, or by using the keyword search tool below to find specific information within the annual report.-
 1
1 -
2
-
3
-
4
-
5
-
6
-
7
-
8
-
9
-
10
-
11
-
12
-
13
-
14
-
15
-
16
-
17
-
18
-
19
-
20
-
21
-
22
-
23
-
24
-
25
-
26
-
27
-
28
-
29
-
30
-
31
-
32
-
33
-
34
-
35
-
36
-
37
-
38
-
39
-
40
-
41
-
42
-
43
-
 44
44 -
 45
45 -
 46
46 -
 47
47 -
 48
48 -
 49
49 -
 50
50 -
 51
51 -
 52
52 -
 53
53 -
 54
54 -
 55
55 -
 56
56 -
 57
57 -
 58
58 -
 59
59 -
 60
60 -
 61
61 -
 62
62 -
 63
63 -
 64
64 -
65
-
66
-
67
-
68
-
69
-
70
-
71
-
72
-
73
-
74
-
75
-
76
-
77
-
78
-
79
-
80
-
81
-
82
-
83
-
84
-
85
-
86
-
87
-
88
-
89
-
90
-
91
-
92
-
93
-
94
-
95
-
96
-
97
-
98
-
99
-
100
-
101
-
102
-
103
-
104
-
105
-
106
-
107
-
108
-
109
-
110
-
111
-
112
-
113
-
114
-
115
-
116
-
117
-
118
-
119
-
120
-
121
-
122
-
123
-
124
-
125
-
126
-
127
-
128
-
129
-
130
-
131
-
132
-
133
-
134
-
135
-
136
-
137
-
138
-
139
-
140
-
141
-
142
-
143
-
144
 |
 |

46
During 2008, impairment charges in the Sigma Fund were $186 million. The impairment charges were
primarily related to the default of investments in Lehman Brothers Holdings, Inc., Washington Mutual, Inc., and
Sigma Finance Corporation, an unrelated special investment vehicle managed by United Kingdom-based Gordian
Knot, Limited.
Securities with a maturity greater than 12 months and defaulted securities have been classified as non-current in
the Company’s consolidated balance sheets. At December 31, 2010, $70 million of the Sigma Fund investments
were classified as non-current, and the weighted average maturity of the Sigma Fund investments classified as
non-current (excluding defaulted securities) was 164 months. At December 31, 2009, $66 million of the Sigma Fund
investments were classified as non-current.
The Company continuously assesses its cash needs and continues to believe that the balance of cash and cash
equivalents, short-term investments and investments in the Sigma Fund classified as current are more than adequate
to meet its current operating requirements over the next twelve months.
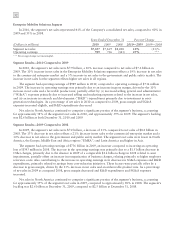
Strategic Acquisitions and Investments: The Company used net cash for acquisitions and new investment
activities of $170 million in 2010, compared to net cash used of $38 million in 2009 and net cash used of
$282 million in 2008. The cash used in 2010 and 2009 were for small strategic investments across the Company.
Capital Expenditures: Capital expenditures were $335 million in 2010, compared to $204 million in 2009
and $408 million in 2008. The Company’s emphasis when making capital expenditure decisions is to focus on
strategic investments driven by customer demand and new design capability.
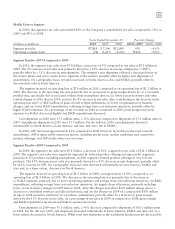
Sales of Investments and Businesses: The Company received $276 million in net proceeds from the sales of
investments and businesses in 2010, compared to proceeds of $343 million in 2009 and proceeds of $120 million in
2008. The $276 million in proceeds in 2010 were primarily comprised of the Company’s Israel-based wireless
network operator business and the sale of a single investment. The $343 million in proceeds in 2009 was primarily
comprised of net proceeds received in connection with sales of: (i) Good Technology, and (ii) the biometrics
business, and the sales of certain of the Company’s equity investments.
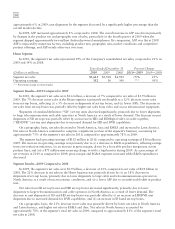
Financing Activities
Net cash used for financing activities was $468 million in 2010, compared to $493 million provided by
financing activities in 2009 and $150 million used in 2008. Cash used for financing activities in the 2010 was
primarily comprised of approximately $1.0 billion for repayment of long-term debt, partially offset by: (i) $383
million of distributions from discontinued operations, and (ii) $179 million of net cash received from the issuance of
common stock in connection with the Company’s employee stock option plans and employee stock purchase plan.
Cash provided by financing activities in 2009 was primarily: (i) $703 million of distributions from discontinued
operations and (ii) $116 million of cash received from the issuance of common stock in connection with the
Company’s employee stock option plans and employee stock purchase plan, partially offset by: (i) $132 million of
cash used for the repayment of long-term debt, (ii) $114 million of cash used to pay dividends, and (iii) $86 million
of cash used for the repayment of short-term borrowings.
Short-Term Debt: At December 31, 2010, the Company’s outstanding notes payable and current portion of
long-term debt was $605 million, compared to $536 million at December 31, 2009.
In November 2010, the Company repaid, at maturity, the entire $527 million aggregate principal amount
outstanding of its 7.625% Notes due November 15, 2010.
Long-term Debt: At December 31, 2010, the Company had outstanding long-term debt of $2.2 billion,
compared to $3.4 billion at December 31, 2009.
During the second quarter of 2010, the Company repurchased approximately $500 million of its outstanding
long-term debt for a purchase price of $477 million, excluding approximately $5 million of accrued interest. The
$500 million of long-term debt repurchased included principal amounts of: (i) $65 million of the $379 million then
outstanding of the 6.50% Debentures due 2025 (the “2025 Debentures”), (ii) $75 million of the $286 million then
outstanding of the 6.50% Debentures due 2028 (the “2028 Debentures”), (iii) $222 million of the $446 million
then outstanding of the 6.625% Senior Notes due 2037 (the “2037 Senior Notes”), and (iv) $138 million of the
$252 million then outstanding of the 5.22% Debentures due 2097. After accelerating the amortization of debt