Motorola 2010 Annual Report Download - page 77
Download and view the complete annual report
Please find page 77 of the 2010 Motorola annual report below. You can navigate through the pages in the report by either clicking on the pages listed below, or by using the keyword search tool below to find specific information within the annual report.-
 1
1 -
2
-
3
-
4
-
5
-
6
-
7
-
8
-
9
-
10
-
11
-
12
-
13
-
14
-
15
-
16
-
17
-
18
-
19
-
20
-
21
-
22
-
23
-
24
-
25
-
26
-
27
-
28
-
29
-
30
-
31
-
32
-
33
-
34
-
35
-
36
-
37
-
38
-
39
-
40
-
41
-
42
-
43
-
44
-
45
-
46
-
47
-
48
-
49
-
50
-
51
-
52
-
53
-
54
-
55
-
56
-
57
-
58
-
59
-
60
-
61
-
62
-
63
-
64
-
65
-
66
-
 67
67 -
 68
68 -
 69
69 -
 70
70 -
 71
71 -
 72
72 -
 73
73 -
 74
74 -
 75
75 -
 76
76 -
 77
77 -
 78
78 -
 79
79 -
 80
80 -
 81
81 -
 82
82 -
 83
83 -
 84
84 -
 85
85 -
 86
86 -
 87
87 -
88
-
89
-
90
-
91
-
92
-
93
-
94
-
95
-
96
-
97
-
98
-
99
-
100
-
101
-
102
-
103
-
104
-
105
-
106
-
107
-
108
-
109
-
110
-
111
-
112
-
113
-
114
-
115
-
116
-
117
-
118
-
119
-
120
-
121
-
122
-
123
-
124
-
125
-
126
-
127
-
128
-
129
-
130
-
131
-
132
-
133
-
134
-
135
-
136
-
137
-
138
-
139
-
140
-
141
-
142
-
143
-
144
 |
 |

69
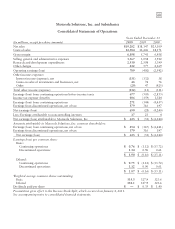
Motorola Solutions, Inc. and Subsidiaries
Consolidated Statements of Operations
Years Ended December 31
(In millions, except per share amounts) 2010 2009 2008
Net sales $19,282 $18,147 $25,109
Costs of sales 12,384 12,406 18,171
Gross margin 6,898 5,741 6,938
Selling, general and administrative expenses 3,367 3,058 3,912
Research and development expenditures 2,530 2,598 3,399
Other charges 212 577 2,169
Operating earnings (loss) 789 (492) (2,542)
Other income (expense):
Interest income (expense), net (131) (132) 38
Gains on sales of investments and businesses, net 48 74 76
Other (29) 47 (425)
Total other income (expense) (112) (11) (311)
Earnings (loss) from continuing operations before income taxes 677 (503) (2,853)
Income tax expense (benefit) 406 (159) 1,584
Earnings (loss) from continuing operations 271 (344) (4,437)
Earnings from discontinued operations, net of tax 379 316 197
Net earnings (loss) 650 (28) (4,240)
Less: Earnings attributable to noncontrolling interests 17 23 4
Net earnings (loss) attributable to Motorola Solutions, Inc. $ 633 $ (51) $ (4,244)
Amounts attributable to Motorola Solutions, Inc. common shareholders:
Earnings (loss) from continuing operations, net of tax $ 254 $ (367) $ (4,441)
Earnings from discontinued operations, net of tax 379 316 197
Net earnings (loss) $ 633 $ (51) $ (4,244)
Earnings (loss) per common share:
Basic:
Continuing operations $ 0.76 $ (1.12) $ (13.72)
Discontinued operations 1.14 0.96 0.61
$ 1.90 $ (0.16) $ (13.11)
Diluted:
Continuing operations $ 0.75 $ (1.12) $ (13.72)
Discontinued operations 1.12 0.96 0.61
$ 1.87 $ (0.16) $ (13.11)
Weighted average common shares outstanding:
Basic 333.3 327.9 323.6
Diluted 338.1 327.9 323.6
Dividends paid per share $—$ 0.35 $ 1.40
Presentation gives effect to the Reverse Stock Split, which occurred on January 4, 2011.
See accompanying notes to consolidated financial statements.