Motorola 2010 Annual Report Download - page 107
Download and view the complete annual report
Please find page 107 of the 2010 Motorola annual report below. You can navigate through the pages in the report by either clicking on the pages listed below, or by using the keyword search tool below to find specific information within the annual report.-
 1
1 -
2
-
3
-
4
-
5
-
6
-
7
-
8
-
9
-
10
-
11
-
12
-
13
-
14
-
15
-
16
-
17
-
18
-
19
-
20
-
21
-
22
-
23
-
24
-
25
-
26
-
27
-
28
-
29
-
30
-
31
-
32
-
33
-
34
-
35
-
36
-
37
-
38
-
39
-
40
-
41
-
42
-
43
-
44
-
45
-
46
-
47
-
48
-
49
-
50
-
51
-
52
-
53
-
54
-
55
-
56
-
57
-
58
-
59
-
60
-
61
-
62
-
63
-
64
-
65
-
66
-
67
-
68
-
69
-
70
-
71
-
72
-
73
-
74
-
75
-
76
-
77
-
78
-
79
-
80
-
81
-
82
-
83
-
84
-
85
-
86
-
87
-
88
-
89
-
90
-
91
-
92
-
93
-
94
-
95
-
96
-
 97
97 -
 98
98 -
 99
99 -
 100
100 -
 101
101 -
 102
102 -
 103
103 -
 104
104 -
 105
105 -
 106
106 -
 107
107 -
 108
108 -
 109
109 -
 110
110 -
 111
111 -
 112
112 -
 113
113 -
 114
114 -
 115
115 -
 116
116 -
 117
117 -
118
-
119
-
120
-
121
-
122
-
123
-
124
-
125
-
126
-
127
-
128
-
129
-
130
-
131
-
132
-
133
-
134
-
135
-
136
-
137
-
138
-
139
-
140
-
141
-
142
-
143
-
144
 |
 |

99
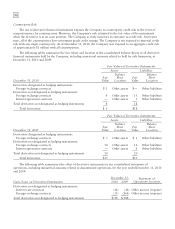
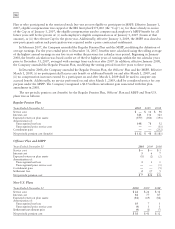
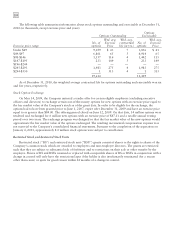
The weighted-average pension plan asset allocation by asset categories:
Actual Mix
December 31 2010 2009
Equity securities 66% 65%
Fixed income securities 32% 32%
Cash and other investments 2% 3%
Within the equity securities asset class, the investment policy provides for investments in a broad range of
publicly-traded securities including both domestic and international stocks. Within the fixed income securities asset
class, the investment policy provides for investments in a broad range of publicly-traded debt securities ranging from
U.S. Treasury issues, corporate debt securities, mortgage and asset-backed securities, as well as international debt
securities. In the cash and other investments asset class, investments may be in cash, cash equivalents or insurance
contracts.
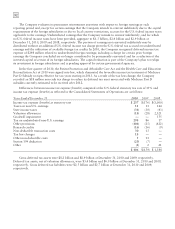
The Company expects to make cash contributions of approximately $240 million to its U.S. pension plans and
approximately $40 million to its non-U.S. pension plans in 2011.
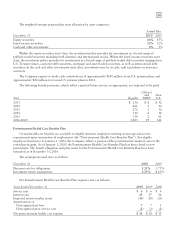
The following benefit payments, which reflect expected future service, as appropriate, are expected to be paid:
Year Regular
Officer’s
and
MSPP
Non
U.S.
2011 $ 250 $8 $52
2012 261 2 54
2013 272 5 56
2014 310 2 58
2015 319 2 61
2016-2020 1,803 19 341
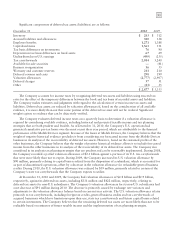
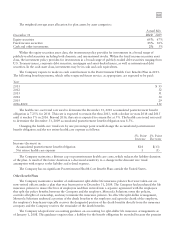
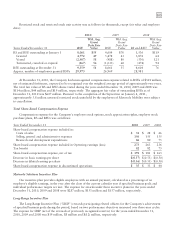
Postretirement Health Care Benefits Plan
Certain health care benefits are available to eligible domestic employees meeting certain age and service
requirements upon termination of employment (the “Postretirement Health Care Benefits Plan”). For eligible
employees hired prior to January 1, 2002, the Company offsets a portion of the postretirement medical costs to the
retired participant. As of January 1, 2005, the Postretirement Health Care Benefits Plan has been closed to new
participants. The benefit obligation and plan assets for the Postretirement Health Care Benefits Plan have been
measured as of December 31, 2010.
The assumptions used were as follows:
December 31 2010 2009
Discount rate for obligations 5.25% 5.75%
Investment return assumptions 8.25% 8.25%
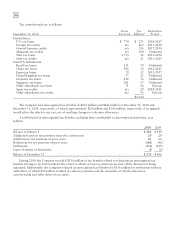
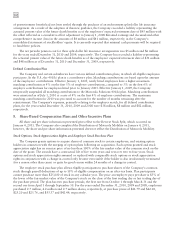
Net Postretirement Health Care Benefits Plan expenses were as follows:
Years Ended December 31 2010 2009 2008
Service cost $6 $6 $6
Interest cost 23 27 26
Expected return on plan assets (16) (18) (20)
Amortization of:
Unrecognized net loss 775
Unrecognized prior service cost (2) (2) (2)
Net postretirement health care expense $18 $20 $15