Motorola 2010 Annual Report Download - page 45
Download and view the complete annual report
Please find page 45 of the 2010 Motorola annual report below. You can navigate through the pages in the report by either clicking on the pages listed below, or by using the keyword search tool below to find specific information within the annual report.-
 1
1 -
2
-
3
-
4
-
5
-
6
-
7
-
8
-
9
-
10
-
11
-
12
-
13
-
14
-
15
-
16
-
17
-
18
-
19
-
20
-
21
-
22
-
23
-
24
-
25
-
26
-
27
-
28
-
29
-
30
-
31
-
32
-
33
-
34
-
 35
35 -
 36
36 -
 37
37 -
 38
38 -
 39
39 -
 40
40 -
 41
41 -
 42
42 -
 43
43 -
 44
44 -
 45
45 -
 46
46 -
 47
47 -
 48
48 -
 49
49 -
 50
50 -
 51
51 -
 52
52 -
 53
53 -
 54
54 -
 55
55 -
56
-
57
-
58
-
59
-
60
-
61
-
62
-
63
-
64
-
65
-
66
-
67
-
68
-
69
-
70
-
71
-
72
-
73
-
74
-
75
-
76
-
77
-
78
-
79
-
80
-
81
-
82
-
83
-
84
-
85
-
86
-
87
-
88
-
89
-
90
-
91
-
92
-
93
-
94
-
95
-
96
-
97
-
98
-
99
-
100
-
101
-
102
-
103
-
104
-
105
-
106
-
107
-
108
-
109
-
110
-
111
-
112
-
113
-
114
-
115
-
116
-
117
-
118
-
119
-
120
-
121
-
122
-
123
-
124
-
125
-
126
-
127
-
128
-
129
-
130
-
131
-
132
-
133
-
134
-
135
-
136
-
137
-
138
-
139
-
140
-
141
-
142
-
143
-
144
 |
 |

37
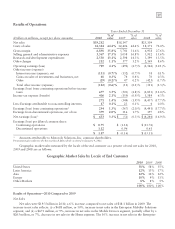
Results of Operations
Years Ended December 31
(Dollars in millions, except per share amounts) 2010 %of
sales 2009
%of
sales 2008
%of
sales
Net sales $19,282 $18,147 $25,109
Costs of sales 12,384 64.2% 12,406 68.4% 18,171 72.4%
Gross margin 6,898 35.8% 5,741 31.6% 6,938 27.6%
Selling, general and administrative expenses 3,367 17.5% 3,058 16.8% 3,912 15.6%
Research and development expenditures 2,530 13.1% 2,598 14.3% 3,399 13.5%
Other charges 212 1.1% 577 3.2% 2,169 8.6%
Operating earnings (loss) 789 4.1% (492) (2.7)% (2,542) (10.1)%
Other income (expense):
Interest income (expense), net (131) (0.7)% (132) (0.7)% 38 0.1%
Gains on sales of investments and businesses, net 48 0.3% 74 0.4% 76 0.3%
Other (29) (0.2)% 47 0.2% (425) (1.7)%
Total other income (expense) (112) (0.6)% (11) (0.1)% (311) (1.3)%
Earnings (loss) from continuing operations before income
taxes 677 3.5% (503) (2.8)% (2,853) (11.4)%
Income tax expense (benefit) 406 2.1% (159) (0.9)% 1,584 6.3%
271 1.4% (344) (1.9)% (4,437) (17.7)%
Less: Earnings attributable to noncontrolling interests 17 0.1% 23 0.1% 4 0.0%
Earnings (loss) from continuing operations* 254 1.3% (367) (2.0)% (4,441) (17.7)%
Earnings from discontinued operations, net of tax 379 2.0% 316 1.7% 197 0.8%
Net earnings (loss)* $ 633 3.3% $ (51) (0.3)% $ (4,244) (16.9)%
Earnings (loss) per diluted common share:
Continuing operations $ 0.75 $ (1.12) $ (13.72)
Discontinued operations 1.12 0.96 0.61
$ 1.87 $ (0.16) $ (13.11)
* Amounts attributable to Motorola Solutions, Inc. common shareholders.
Presentation gives effect to the Reverse Stock Split, which occurred on January 4, 2011.
Geographic market sales measured by the locale of the end customer as a percent of total net sales for 2010,
2009 and 2008 are as follows:
Geographic Market Sales by Locale of End Customer
2010 2009 2008
United States 58% 58% 55%
Latin America 12% 13% 17%
Asia 12% 12% 12%
Europe 10% 9% 11%
Other Markets 8% 8% 5%
100% 100% 100%
Results of Operations—2010 Compared to 2009
Net Sales
Net sales were $19.3 billion in 2010, a 6% increase compared to net sales of $18.1 billion in 2009. The
increase in net sales reflects: (i) a $688 million, or 10%, increase in net sales in the Enterprise Mobility Solutions
segment, and (ii) a $673 million, or 9%, increase in net sales in the Mobile Devices segment, partially offset by a
$263 million, or 7%, decrease in net sales in the Home segment. The 10% increase in net sales in the Enterprise