Motorola 2010 Annual Report Download - page 78
Download and view the complete annual report
Please find page 78 of the 2010 Motorola annual report below. You can navigate through the pages in the report by either clicking on the pages listed below, or by using the keyword search tool below to find specific information within the annual report.-
 1
1 -
2
-
3
-
4
-
5
-
6
-
7
-
8
-
9
-
10
-
11
-
12
-
13
-
14
-
15
-
16
-
17
-
18
-
19
-
20
-
21
-
22
-
23
-
24
-
25
-
26
-
27
-
28
-
29
-
30
-
31
-
32
-
33
-
34
-
35
-
36
-
37
-
38
-
39
-
40
-
41
-
42
-
43
-
44
-
45
-
46
-
47
-
48
-
49
-
50
-
51
-
52
-
53
-
54
-
55
-
56
-
57
-
58
-
59
-
60
-
61
-
62
-
63
-
64
-
65
-
66
-
67
-
 68
68 -
 69
69 -
 70
70 -
 71
71 -
 72
72 -
 73
73 -
 74
74 -
 75
75 -
 76
76 -
 77
77 -
 78
78 -
 79
79 -
 80
80 -
 81
81 -
 82
82 -
 83
83 -
 84
84 -
 85
85 -
 86
86 -
 87
87 -
 88
88 -
89
-
90
-
91
-
92
-
93
-
94
-
95
-
96
-
97
-
98
-
99
-
100
-
101
-
102
-
103
-
104
-
105
-
106
-
107
-
108
-
109
-
110
-
111
-
112
-
113
-
114
-
115
-
116
-
117
-
118
-
119
-
120
-
121
-
122
-
123
-
124
-
125
-
126
-
127
-
128
-
129
-
130
-
131
-
132
-
133
-
134
-
135
-
136
-
137
-
138
-
139
-
140
-
141
-
142
-
143
-
144
 |
 |

70
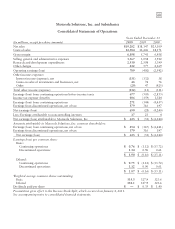
Motorola Solutions, Inc. and Subsidiaries
Consolidated Balance Sheets
December 31
(In millions, except per share amounts) 2010 2009
ASSETS
Cash and cash equivalents $ 4,208 $ 2,869
Sigma Fund and short-term investments 4,655 5,094
Accounts receivable, net 3,268 2,845
Inventories, net 1,364 1,097
Deferred income taxes 1,338 1,082
Other current assets 1,342 1,389
Current assets held for sale 979 1,656
Total current assets 17,154 16,032
Property, plant and equipment, net 1,729 1,819
Sigma Fund 70 66
Investments 310 456
Deferred income taxes 1,619 2,283
Goodwill 2,825 2,714
Other assets 1,428 1,680
Non-current assets held for sale 442 553
Total assets $25,577 $25,603
LIABILITIES AND STOCKHOLDERS’ EQUITY
Notes payable and current portion of long-term debt $ 605 $ 536
Accounts payable 2,462 1,998
Accrued liabilities 4,704 4,141
Current liabilities held for sale 939 1,586
Total current liabilities 8,710 8,261
Long-term debt 2,194 3,365
Other liabilities 3,542 3,987
Non-current liabilities held for sale 144 107
Stockholders’ Equity
Preferred stock, $100 par value ——
Common stock: 12/31/10—$.01 par value; 12/31/09—$.01 par value 33
Authorized shares: 12/31/10—600.0; 12/31/09—600.0
Issued shares: 12/31/10—337.2; 12/31/09—330.6
Outstanding shares: 12/31/10—336.3; 12/31/09—330.3
Additional paid-in capital 8,644 8,231
Retained earnings 4,460 3,827
Accumulated other comprehensive loss (2,222) (2,286)
Total Motorola Solutions, Inc. stockholders’ equity 10,885 9,775
Noncontrolling interests 102 108
Total stockholders’ equity 10,987 9,883
Total liabilities and stockholders’ equity $25,577 $25,603
Presentation gives effect to the Reverse Stock Split, which occurred on January 4, 2011.
See accompanying notes to consolidated financial statements.