Motorola 2010 Annual Report Download - page 42
Download and view the complete annual report
Please find page 42 of the 2010 Motorola annual report below. You can navigate through the pages in the report by either clicking on the pages listed below, or by using the keyword search tool below to find specific information within the annual report.-
 1
1 -
2
-
3
-
4
-
5
-
6
-
7
-
8
-
9
-
10
-
11
-
12
-
13
-
14
-
15
-
16
-
17
-
18
-
19
-
20
-
21
-
22
-
23
-
24
-
25
-
26
-
27
-
28
-
29
-
30
-
31
-
 32
32 -
 33
33 -
 34
34 -
 35
35 -
 36
36 -
 37
37 -
 38
38 -
 39
39 -
 40
40 -
 41
41 -
 42
42 -
 43
43 -
 44
44 -
 45
45 -
 46
46 -
 47
47 -
 48
48 -
 49
49 -
 50
50 -
 51
51 -
 52
52 -
53
-
54
-
55
-
56
-
57
-
58
-
59
-
60
-
61
-
62
-
63
-
64
-
65
-
66
-
67
-
68
-
69
-
70
-
71
-
72
-
73
-
74
-
75
-
76
-
77
-
78
-
79
-
80
-
81
-
82
-
83
-
84
-
85
-
86
-
87
-
88
-
89
-
90
-
91
-
92
-
93
-
94
-
95
-
96
-
97
-
98
-
99
-
100
-
101
-
102
-
103
-
104
-
105
-
106
-
107
-
108
-
109
-
110
-
111
-
112
-
113
-
114
-
115
-
116
-
117
-
118
-
119
-
120
-
121
-
122
-
123
-
124
-
125
-
126
-
127
-
128
-
129
-
130
-
131
-
132
-
133
-
134
-
135
-
136
-
137
-
138
-
139
-
140
-
141
-
142
-
143
-
144
 |
 |

34
Item 7: Management’s Discussion and Analysis of Financial Condition and Results of Operations
The following is a discussion and analysis of our financial position and results of operations for each of the
three years in the period ended December 31, 2010, prior to the separation of Motorola Mobility. This commentary
should be read in conjunction with our consolidated financial statements and the notes thereto appearing under
“Item 8: Financial Statements and Supplementary Data.”
Executive Overview
What businesses are we in?
Through December 31, 2010, the Company reported financial results for three operating business segments,
which were comprised of two main business units. Following the Separation of Motorola Mobility on January 4,
2011, only the Enterprise Mobility Solutions segment remains part of the Company.
Motorola Solutions
• The Enterprise Mobility Solutions segment designs, manufactures, sells, installs and services analog and
digital two-way radios, wireless LAN and security products, voice and data communications products and
systems primarily for private networks, wireless broadband systems and end-to-end enterprise mobility
solutions to a wide range of customers, including government and public safety agencies (which, together
with all sales to distributors of two-way communication products, are referred to as the “government and
public safety market”), as well as retail, energy and utilities, transportation, manufacturing, healthcare and
other commercial customers (which, collectively, are referred to as the “commercial enterprise market”). The
segment’s net sales in 2010 were $7.9 billion, representing 41% of the Company’s consolidated net sales.
Motorola Mobility
• The Mobile Devices segment designs, manufactures, sells and services wireless mobile devices, including
smartphones, with integrated software and accessory products, and licenses intellectual property. The
segment’s net sales in 2010 were $7.8 billion, representing 40% of the Company’s consolidated net sales.
• The Home segment designs, manufactures, sells, installs and services set-top boxes for digital video, Internet
Protocol (“IP”) video, satellite and terrestrial broadcast networks, end-to-end digital video and Internet
protocol television (“IPTV”) distribution systems, broadband access network infrastructure platforms, and
associated data and voice customer premises equipment and associated software solutions to cable television
(“TV”) and telecommunication service providers. The segment’s net sales in 2010 were $3.6 billion,
representing 19% of the Company’s consolidated net sales.
What were our 2010 financial results?
• Our net sales were $19.3 billion in 2010, up 6% compared to net sales of $18.1 billion in 2009.
• We had operating earnings of $789 million in 2010, compared to incurring an operating loss of $492 million
in 2009. Operating margin was 4.1% of net sales in 2010, compared to (2.7)% of net sales in 2009.
• We had earnings from continuing operations of $271 million, or $0.75 per diluted common share, in 2010,
compared to a loss from continuing operations of $344 million, or $1.12 per diluted common share, in 2009.
• We generated cash from operating activities of $1.5 billion in 2010, compared to using $95 million of cash
for operating activities in 2009.
• We increased the aggregate of our: (i) cash and cash equivalents balances, (ii) Sigma Fund and short-term
investments, and (iii) long-term Sigma Fund, by $904 million from $8.0 billion as of December 31, 2009 to
$8.9 billion as of December 31, 2010. Conversely, we decreased the aggregate of our: (i) notes payable and
the current portion of long-term debt, and (ii) long-term debt, by approximately $1.1 billion from $3.9
billion as of December 31, 2009 to $2.8 billion as of December 31, 2010.
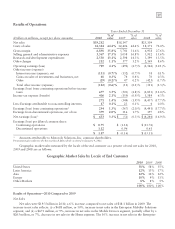
What were the financial results for our three operating business segments in 2010?
•In Our Enterprise Mobility Solutions Business: Net sales were $7.9 billion in 2010, an increase of 10%
compared to net sales of $7.2 billion in 2009. On a geographic basis, net sales increased in all regions.