Motorola 2010 Annual Report Download - page 98
Download and view the complete annual report
Please find page 98 of the 2010 Motorola annual report below. You can navigate through the pages in the report by either clicking on the pages listed below, or by using the keyword search tool below to find specific information within the annual report.-
 1
1 -
2
-
3
-
4
-
5
-
6
-
7
-
8
-
9
-
10
-
11
-
12
-
13
-
14
-
15
-
16
-
17
-
18
-
19
-
20
-
21
-
22
-
23
-
24
-
25
-
26
-
27
-
28
-
29
-
30
-
31
-
32
-
33
-
34
-
35
-
36
-
37
-
38
-
39
-
40
-
41
-
42
-
43
-
44
-
45
-
46
-
47
-
48
-
49
-
50
-
51
-
52
-
53
-
54
-
55
-
56
-
57
-
58
-
59
-
60
-
61
-
62
-
63
-
64
-
65
-
66
-
67
-
68
-
69
-
70
-
71
-
72
-
73
-
74
-
75
-
76
-
77
-
78
-
79
-
80
-
81
-
82
-
83
-
84
-
85
-
86
-
87
-
 88
88 -
 89
89 -
 90
90 -
 91
91 -
 92
92 -
 93
93 -
 94
94 -
 95
95 -
 96
96 -
 97
97 -
 98
98 -
 99
99 -
 100
100 -
 101
101 -
 102
102 -
 103
103 -
 104
104 -
 105
105 -
 106
106 -
 107
107 -
 108
108 -
109
-
110
-
111
-
112
-
113
-
114
-
115
-
116
-
117
-
118
-
119
-
120
-
121
-
122
-
123
-
124
-
125
-
126
-
127
-
128
-
129
-
130
-
131
-
132
-
133
-
134
-
135
-
136
-
137
-
138
-
139
-
140
-
141
-
142
-
143
-
144
 |
 |

90
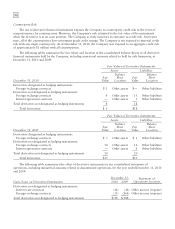
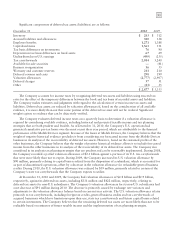
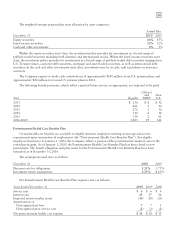
Counterparty Risk
The use of derivative financial instruments exposes the Company to counterparty credit risk in the event of
nonperformance by counterparties. However, the Company’s risk is limited to the fair value of the instruments
when the derivative is in an asset position. The Company actively monitors its exposure to credit risk. At present
time, all of the counterparties have investment grade credit ratings. The Company is not exposed to material credit
risk with any single counterparty. As of December 31, 2010, the Company was exposed to an aggregate credit risk
of approximately $1 million with all counterparties.
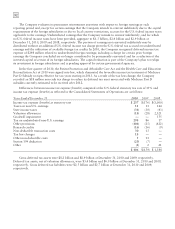
The following tables summarize the fair values and location in the consolidated balance sheets of all derivative
financial instruments held by the Company, including immaterial amounts related to held for sale businesses, at
December 31, 2010 and 2009:
Fair Values of Derivative Instruments
Assets Liabilities
December 31, 2010
Fair
Value
Balance
Sheet
Location
Fair
Value
Balance
Sheet
Location
Derivatives designated as hedging instruments:
Foreign exchange contracts $ 1 Other assets $— Other liabilities
Derivatives not designated as hedging instruments:
Foreign exchange contracts 4 Other assets 15 Other liabilities
Interest agreement contracts — Other assets 3 Other liabilities
Total derivatives not designated as hedging instruments 4 18
Total derivatives $ 5 $18
Fair Values of Derivative Instruments
Assets Liabilities
December 31, 2009
Fair
Value
Balance
Sheet
Location
Fair
Value
Balance
Sheet
Location
Derivatives designated as hedging instruments:
Foreign exchange contracts $ 5 Other assets $ 1 Other liabilities
Derivatives not designated as hedging instruments:
Foreign exchange contracts 10 Other assets 16 Other liabilities
Interest agreement contracts — Other assets 4 Other liabilities
Total derivatives not designated as hedging instruments 10 20
Total derivatives $15 $21
The following table summarizes the effect of derivative instruments in our consolidated statements of
operations, including immaterial amounts related to discontinued operations, for the year ended December 31, 2010
and 2009:
December 31, Statement of
Operations Location
Gain (Loss) on Derivative Instruments 2010 2009
Derivatives not designated as hedging instruments:
Interest rate contracts (16) (16) Other income (expense)
Foreign exchange contracts (33) (166) Other income (expense)
Total derivatives not designated as hedging instruments $(49) $(182)