Motorola 2010 Annual Report Download - page 115
Download and view the complete annual report
Please find page 115 of the 2010 Motorola annual report below. You can navigate through the pages in the report by either clicking on the pages listed below, or by using the keyword search tool below to find specific information within the annual report.-
 1
1 -
2
-
3
-
4
-
5
-
6
-
7
-
8
-
9
-
10
-
11
-
12
-
13
-
14
-
15
-
16
-
17
-
18
-
19
-
20
-
21
-
22
-
23
-
24
-
25
-
26
-
27
-
28
-
29
-
30
-
31
-
32
-
33
-
34
-
35
-
36
-
37
-
38
-
39
-
40
-
41
-
42
-
43
-
44
-
45
-
46
-
47
-
48
-
49
-
50
-
51
-
52
-
53
-
54
-
55
-
56
-
57
-
58
-
59
-
60
-
61
-
62
-
63
-
64
-
65
-
66
-
67
-
68
-
69
-
70
-
71
-
72
-
73
-
74
-
75
-
76
-
77
-
78
-
79
-
80
-
81
-
82
-
83
-
84
-
85
-
86
-
87
-
88
-
89
-
90
-
91
-
92
-
93
-
94
-
95
-
96
-
97
-
98
-
99
-
100
-
101
-
102
-
103
-
104
-
 105
105 -
 106
106 -
 107
107 -
 108
108 -
 109
109 -
 110
110 -
 111
111 -
 112
112 -
 113
113 -
 114
114 -
 115
115 -
 116
116 -
 117
117 -
 118
118 -
 119
119 -
 120
120 -
 121
121 -
 122
122 -
 123
123 -
 124
124 -
 125
125 -
126
-
127
-
128
-
129
-
130
-
131
-
132
-
133
-
134
-
135
-
136
-
137
-
138
-
139
-
140
-
141
-
142
-
143
-
144
 |
 |

107
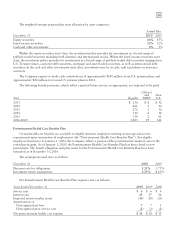
The following table summarizes the changes in fair value of our Level 3 assets:
2010 2009
Balance at January 1 $19 $134
Transfers to (from) Level 3 3(16)
Payments received and securities sold (11) (78)
Permanent impairments — (2)
Mark-to-market gain (loss) on Sigma Fund investments included in Other income (expense) 4(19)
Balance at December 31 $15 $19
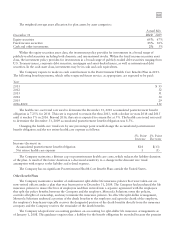
Pension and Postretirement Health Care Benefits Plan Assets
The fair value of the various pension and postretirement health care benefits plans’ assets by level in the fair
value hierarchy as of December 31, 2010 were as follows:
Regular Plan
December 31, 2010 Level 1 Level 2 Level 3 Total
Common stock and equivalents $1,222 $ 3 — $1,225
Commingled equity funds — 1,597 — 1,597
Preferred stock 9 — — 9
U.S. government and agency obligations — 100 — 100
Other government bonds — 5 — 5
Corporate bonds — 185 — 185
Mortgage-backed bonds — 197 — 197
Asset-backed bonds — 40 — 40
Commingled bond funds — 850 — 850
Commingled short-term investment funds — 76 — 76
Invested cash — 16 — 16
Total investment securities $1,231 $3,069 $— $4,300
Accrued income receivable 8
Fair value plan assets $4,308
The table above includes securities on loan as part of a securities lending arrangement of $92 million of
common stock and equivalents, $41 million of U.S. government and agency obligations and $34 million of
corporate bonds. All securities on loan are fully cash collateralized.
The following table summarizes the changes in fair value of the Regular Plan assets measured using Level 3
inputs:
2010
Balance at January 1 $7
Gain on assets held 1
Sales (1)
Transfers out, net (7)
Balance at December 31 $—
Officers’ Plan
December 31, 2010 Level 1 Level 2 Level 3 Total
U.S. government and agencies $— $ 9 $— $ 9
Corporate bonds — 1 — 1
Mortgage-backed bonds — 1 — 1
Commingled short-term investment funds — 1 — 1
Fair value plan assets $— $12 $— $12