Kroger 2010 Annual Report Download - page 93
Download and view the complete annual report
Please find page 93 of the 2010 Kroger annual report below. You can navigate through the pages in the report by either clicking on the pages listed below, or by using the keyword search tool below to find specific information within the annual report.-
 1
1 -
2
-
3
-
4
-
5
-
6
-
7
-
8
-
9
-
10
-
11
-
12
-
13
-
14
-
15
-
16
-
17
-
18
-
19
-
20
-
21
-
22
-
23
-
24
-
25
-
26
-
27
-
28
-
29
-
30
-
31
-
32
-
33
-
34
-
35
-
36
-
37
-
38
-
39
-
40
-
41
-
42
-
43
-
44
-
45
-
46
-
47
-
48
-
49
-
50
-
51
-
52
-
53
-
54
-
55
-
56
-
57
-
58
-
59
-
60
-
61
-
62
-
63
-
64
-
65
-
66
-
67
-
68
-
69
-
70
-
71
-
72
-
73
-
74
-
75
-
76
-
77
-
78
-
79
-
80
-
81
-
82
-
 83
83 -
 84
84 -
 85
85 -
 86
86 -
 87
87 -
 88
88 -
 89
89 -
 90
90 -
 91
91 -
 92
92 -
 93
93 -
 94
94 -
 95
95 -
 96
96 -
 97
97 -
 98
98 -
 99
99 -
 100
100 -
 101
101 -
 102
102 -
 103
103 -
104
-
105
-
106
-
107
-
108
-
109
-
110
-
111
-
112
-
113
-
114
-
115
-
116
-
117
-
118
-
119
-
120
-
121
-
122
-
123
-
124
-
125
-
126
-
127
-
128
-
129
-
130
-
131
-
132
-
133
-
134
-
135
-
136
-
137
-
138
-
139
-
140
-
141
-
142
-
143
-
144
-
145
-
146
-
147
-
148
-
149
-
150
-
151
-
152
-
153
-
154
-
155
-
156
 |
 |

A-13
2009 would have been 35.8%. In addition, the effective tax rate for 2009 differed from the expected federal
statutory rate due to the resolution of certain tax issues and the effect of state income taxes. The 2008
effective tax rate differed from the federal statutory rate primarily due to the effect of state income taxes.
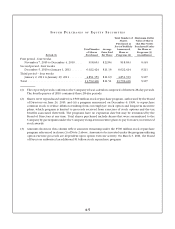
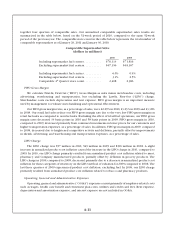
CO M M O N ST O C K RE P U R C H A S E PR O G R A M
We maintain stock repurchase programs that comply with Securities Exchange Act Rule 10b5-1 and
allow for the orderly repurchase of our common stock, from time to time. We made open market purchases
of Kroger stock totaling $505 million in 2010, $156 million in 2009 and $448 million in 2008 under these
repurchase programs. In addition to these repurchase programs, in December 1999 we began a program
to repurchase common stock to reduce dilution resulting from our employee stock option plans. This
program is solely funded by proceeds from stock option exercises, and the tax benefit from these exercises.
We repurchased approximately $40 million in 2010, $62 million in 2009 and $189 million in 2008 of
Kroger stock under the stock option program.
On March 3, 2011, the Board of Directors authorized an additional $1 billion stock repurchase
program.
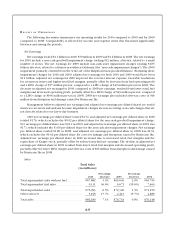
CA P I T A L EX P E N D I T U R E S
Capital expenditures, including changes in construction-in-progress payables and excluding
acquisitions and the purchase of leased facilities, totaled $1.9 billion in 2010 compared to $2.2 billion in
2009 and $2.1 billion in 2008. The decrease in capital expenditures in 2010 was due to Kroger reducing
the capital expenditures in our original plan in order to provide the cash flow necessary to execute our
financial strategy. The increase in capital spending in 2009 compared to 2008 was the result of increasing
our focus on merchandising and productivity projects. Capital expenditures for the purchase of leased
facilities totaled $38 million in 2010 compared to $164 million for 2009 and $27 million for 2008. The
decrease in capital expenditures for the purchase of leased facilities compared to 2009 was due to Kroger
purchasing several more previously leased retail stores and one large distribution center in 2009 compared
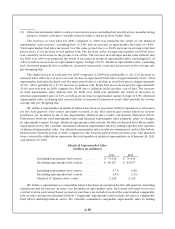
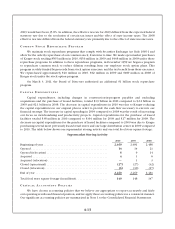
to 2010. The table below shows our supermarket storing activity and our total food store square footage:
Supermarket Storing Activity
2010 2009 2008
Beginning of year ......................................... 2,469 2,481 2,486
Opened ................................................. 14 14 21
Opened (relocation) ....................................... 69 14
Acquired ................................................ 41 6
Acquired (relocation) ...................................... — 1 3
Closed (operational) ....................................... (27) (27) (32)
Closed (relocation) ........................................ (6) (10) (17)
End of year .............................................. 2,460 2,469 2,481
Total food store square footage (in millions) .................... 149 148 147
CR I T I C A L AC C O U N T I N G PO L I C I E S
We have chosen accounting policies that we believe are appropriate to report accurately and fairly
our operating results and financial position, and we apply those accounting policies in a consistent manner.
Our significant accounting policies are summarized in Note 1 to the Consolidated Financial Statements.