Kroger 2010 Annual Report Download - page 39
Download and view the complete annual report
Please find page 39 of the 2010 Kroger annual report below. You can navigate through the pages in the report by either clicking on the pages listed below, or by using the keyword search tool below to find specific information within the annual report.-
 1
1 -
2
-
3
-
4
-
5
-
6
-
7
-
8
-
9
-
10
-
11
-
12
-
13
-
14
-
15
-
16
-
17
-
18
-
19
-
20
-
21
-
22
-
23
-
24
-
25
-
26
-
27
-
28
-
 29
29 -
 30
30 -
 31
31 -
 32
32 -
 33
33 -
 34
34 -
 35
35 -
 36
36 -
 37
37 -
 38
38 -
 39
39 -
 40
40 -
 41
41 -
 42
42 -
 43
43 -
 44
44 -
 45
45 -
 46
46 -
 47
47 -
 48
48 -
 49
49 -
50
-
51
-
52
-
53
-
54
-
55
-
56
-
57
-
58
-
59
-
60
-
61
-
62
-
63
-
64
-
65
-
66
-
67
-
68
-
69
-
70
-
71
-
72
-
73
-
74
-
75
-
76
-
77
-
78
-
79
-
80
-
81
-
82
-
83
-
84
-
85
-
86
-
87
-
88
-
89
-
90
-
91
-
92
-
93
-
94
-
95
-
96
-
97
-
98
-
99
-
100
-
101
-
102
-
103
-
104
-
105
-
106
-
107
-
108
-
109
-
110
-
111
-
112
-
113
-
114
-
115
-
116
-
117
-
118
-
119
-
120
-
121
-
122
-
123
-
124
-
125
-
126
-
127
-
128
-
129
-
130
-
131
-
132
-
133
-
134
-
135
-
136
-
137
-
138
-
139
-
140
-
141
-
142
-
143
-
144
-
145
-
146
-
147
-
148
-
149
-
150
-
151
-
152
-
153
-
154
-
155
-
156
 |
 |

37
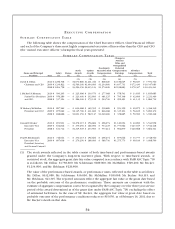
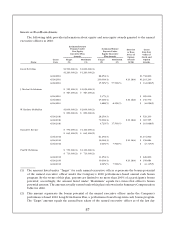
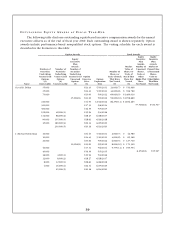
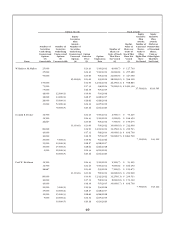
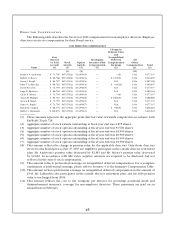
GR A N T S O F PL A N -BA S E D AW A R D S
The following table provides information about equity and non-equity awards granted to the named
executive officers in 2010:
Estimated Future
Payouts Under
Non-Equity
Incentive Plan
Awards
Estimated Future
Payouts Under
Equity Incentive
Plan Awards
Exercise
or Base
Price of
Option
Awards
($/Sh)
Grant
Date Fair
Value of
Stock and
Option
AwardsName
Grant
Date
Target
($)
Maximum
($)
Target
(#)
Maximum
(#)
David B. Dillon $1,500,000(1) $3,000,000(1)
$1,260,000(2) $1,260,000(2)
6/24/2010 86,250(3) $1,738,800
6/24/2010 230,000(4) $20.16(4) $1,201,240
6/24/2010 15,525(5) 57,500(5) $ 332,080 (5)
J. Michael Schlotman $ 525,000(1) $1,050,000(1)
$ 567,000(2) $ 567,000(2)
6/24/2010 9,375(3) $ 189,000
6/24/2010 25,000(4) $20.16(4) $ 130,570
6/24/2010 1,688(5) 6,250(5) $ 36,096(5)
W. Rodney McMullen $1,000,000(1) $2,000,000(1)
$ 890,000(2) $ 890,000(2)
6/24/2010 26,250(3) $ 529,200
6/24/2010 70,000(4) $20.16(4) $ 365,595
6/24/2010 4,725(5) 17,500(5) $ 101,068(5)
Donald E. Becker $ 550,000(1) $1,100,000(1)
$ 645,000(2) $ 645,000(2)
6/24/2010 61,250(3) $1,234,800
6/24/2010 30,000(4) $20.16(4) $ 156,684
6/24/2010 2,025(5) 7,500(5) $ 43,315(5)
Paul W. Heldman $ 550,000(1) $1,100,000(1)
$ 710,000(2) $ 710,000(2)
6/24/2010 11,250(3) $ 226,800
6/24/2010 30,000(4) $20.16(4) $ 156,684
6/24/2010 2,025(5) 7,500(5) $ 43,315(5)
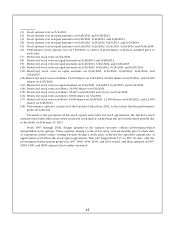
(1) The amount listed under “Target” for each named executive officer represents the bonus potential
of the named executive officer under the Company’s 2010 performance-based annual cash bonus
program. By the terms of this plan, payouts are limited to no more than 200% of a participant’s bonus
potential; accordingly, the amount listed under “Maximum” equals two times that officer’s bonus
potential amount. The amount actually earned under this plan is shown in the Summary Compensation
Table for 2010.
(2) This amount represents the bonus potential of the named executive officer under the Company’s
performance-based 2010 Long-Term Bonus Plan, a performance-based long-term cash bonus program.
The “Target” amount equals the annual base salary of the named executive officer as of the last day