Kroger 2010 Annual Report Download - page 125
Download and view the complete annual report
Please find page 125 of the 2010 Kroger annual report below. You can navigate through the pages in the report by either clicking on the pages listed below, or by using the keyword search tool below to find specific information within the annual report.-
 1
1 -
2
-
3
-
4
-
5
-
6
-
7
-
8
-
9
-
10
-
11
-
12
-
13
-
14
-
15
-
16
-
17
-
18
-
19
-
20
-
21
-
22
-
23
-
24
-
25
-
26
-
27
-
28
-
29
-
30
-
31
-
32
-
33
-
34
-
35
-
36
-
37
-
38
-
39
-
40
-
41
-
42
-
43
-
44
-
45
-
46
-
47
-
48
-
49
-
50
-
51
-
52
-
53
-
54
-
55
-
56
-
57
-
58
-
59
-
60
-
61
-
62
-
63
-
64
-
65
-
66
-
67
-
68
-
69
-
70
-
71
-
72
-
73
-
74
-
75
-
76
-
77
-
78
-
79
-
80
-
81
-
82
-
83
-
84
-
85
-
86
-
87
-
88
-
89
-
90
-
91
-
92
-
93
-
94
-
95
-
96
-
97
-
98
-
99
-
100
-
101
-
102
-
103
-
104
-
105
-
106
-
107
-
108
-
109
-
110
-
111
-
112
-
113
-
114
-
 115
115 -
 116
116 -
 117
117 -
 118
118 -
 119
119 -
 120
120 -
 121
121 -
 122
122 -
 123
123 -
 124
124 -
 125
125 -
 126
126 -
 127
127 -
 128
128 -
 129
129 -
 130
130 -
 131
131 -
 132
132 -
 133
133 -
 134
134 -
 135
135 -
136
-
137
-
138
-
139
-
140
-
141
-
142
-
143
-
144
-
145
-
146
-
147
-
148
-
149
-
150
-
151
-
152
-
153
-
154
-
155
-
156
 |
 |

A-45
NO T E S T O CO N S O L I D A T E D FI N A N C I A L ST A T E M E N T S , CO N T I N U E D
Based on current and future expected cash flows, the Company believes additional goodwill
impairments are not reasonably possible. A 10% reduction in fair value of the Company’s reporting units
would not indicate a potential for impairment of the Company’s remaining goodwill balance, except for
one non-supermarket reporting unit with recorded goodwill of $77. The fair value of this reporting unit
was estimated using discounted cash flows. The discounted cash flows assume long-term sales growth
rates comparable to historical performances and a discount rate of 12.5%.
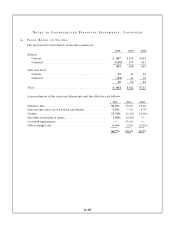
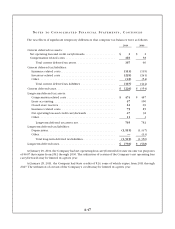
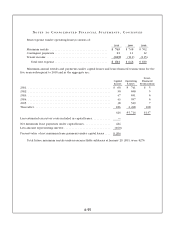
3. PR O P E R T Y , PL A N T A N D EQ U I P M E N T , NE T
Property, plant and equipment, net consists of:
2010 2009
Land ...................................................... $ 2,168 $ 2,058
Buildings and land improvements . . . . . . . . . . . . . . . . . . . . . . . . . . . . . . 7,417 6,999
Equipment ................................................. 9,806 9,553
Leasehold improvements ..................................... 5,852 5,483
Construction-in-progress ..................................... 904 1,010
Leased property under capital leases and financing obligations ....... 569 570
Total property, plant and equipment . . . . . . . . . . . . . . . . . . . . . . . . . . 26,716 25,673
Accumulated depreciation and amortization ...................... (12,569) (11,744)
Property, plant and equipment, net . . . . . . . . . . . . . . . . . . . . . . . . . . . $ 14,147 $ 13,929
Accumulated depreciation for leased property under capital leases was $317 at January 29, 2011, and
$299 at January 30, 2010.
Approximately $247 and $382, original cost, of Property, Plant and Equipment collateralized certain
mortgages at January 29, 2011 and January 30, 2010, respectively.