Kroger 2010 Annual Report Download - page 30
Download and view the complete annual report
Please find page 30 of the 2010 Kroger annual report below. You can navigate through the pages in the report by either clicking on the pages listed below, or by using the keyword search tool below to find specific information within the annual report.-
 1
1 -
2
-
3
-
4
-
5
-
6
-
7
-
8
-
9
-
10
-
11
-
12
-
13
-
14
-
15
-
16
-
17
-
18
-
19
-
 20
20 -
 21
21 -
 22
22 -
 23
23 -
 24
24 -
 25
25 -
 26
26 -
 27
27 -
 28
28 -
 29
29 -
 30
30 -
 31
31 -
 32
32 -
 33
33 -
 34
34 -
 35
35 -
 36
36 -
 37
37 -
 38
38 -
 39
39 -
 40
40 -
41
-
42
-
43
-
44
-
45
-
46
-
47
-
48
-
49
-
50
-
51
-
52
-
53
-
54
-
55
-
56
-
57
-
58
-
59
-
60
-
61
-
62
-
63
-
64
-
65
-
66
-
67
-
68
-
69
-
70
-
71
-
72
-
73
-
74
-
75
-
76
-
77
-
78
-
79
-
80
-
81
-
82
-
83
-
84
-
85
-
86
-
87
-
88
-
89
-
90
-
91
-
92
-
93
-
94
-
95
-
96
-
97
-
98
-
99
-
100
-
101
-
102
-
103
-
104
-
105
-
106
-
107
-
108
-
109
-
110
-
111
-
112
-
113
-
114
-
115
-
116
-
117
-
118
-
119
-
120
-
121
-
122
-
123
-
124
-
125
-
126
-
127
-
128
-
129
-
130
-
131
-
132
-
133
-
134
-
135
-
136
-
137
-
138
-
139
-
140
-
141
-
142
-
143
-
144
-
145
-
146
-
147
-
148
-
149
-
150
-
151
-
152
-
153
-
154
-
155
-
156
 |
 |

28
Over time the Committee has placed an increased emphasis on the strategic plan by making the target
more difficult to achieve. The bonus plan allows for minimal bonus to be earned at relatively low levels to
provide incentive for achieving even higher levels of performance.
Following the close of the year, the Committee reviewed Kroger’s performance against the identical
sales, EBITDA, and strategic plan objectives and determined the extent to which Kroger achieved those
objectives. Kroger’s EBITDA for 2010 was $3.696 billion, and Kroger’s identical retail sales for 2010,
excluding supermarket fuel, were 2.9%. In 2010, Kroger’s supermarket fuel EBITDA was $141.967 million,
or 122.3% of the goal established at the beginning of the year, exceeding the 85% threshold necessary
to earn a bonus for the fuel component. Kroger’s sale of fuel in identical supermarket fuel centers was
2.972 billion gallons, or 5.0% over the prior year. We operated 1,014 supermarket fuel centers as of the end
of 2010, exceeding our goal of 1,000 centers. As a result, the officers earned the additional 5% fuel bonus.
As a result of the Company’s performance when compared to the targets established by the Committee,
and based on the business plan adopted by the Board of Directors, the named executive officers earned
53.868% of their bonus potentials, which percentage payout exceeds that of last year but is substantially
lower than the bonus payouts over the previous several years. This principally reflects the degree to which
Kroger achieved its aggressive EBITDA and sales goals.
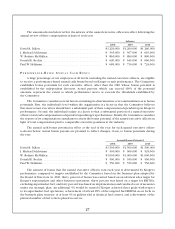
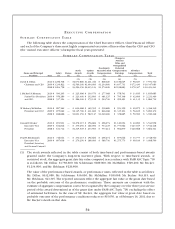
The 2010 targets established by the Committee for annual bonus amounts based on identical sales and
EBITDA results, the actual 2010 results, and the bonus percentage earned in each of the components of
named executive officer bonus, were as follows:
Targets
Component Minimum 100% Result Amount Earned
Identical Sales ..................... 1.0% 3.0%/4.0%* 2.9 % 14.235%
EBITDA . . . . . . . . . . . . . . . . . . . . . . . . . . $3.279 Billion $3.858 Billion** $3.696 Billion 12.989%
Strategic Plan*** .................... 21.644%
Fuel Bonus ........................ [as described in the text above] 5.000%
53.868%
* Identical sales of 3% pay at 100% if EBITDA and operating cost goals are achieved. If EBITDA and
operating cost goals are not achieved, identical sales of 4% pay at 100%. Operating cost goals are not
disclosed as they are competitively sensitive.
** Payout is at 135% if identical sales and operating cost goals are achieved. Operating cost goals are not
disclosed as they are competitively sensitive.
*** The Strategic Plan component also was established by the Committee but is not disclosed as it is
competitively sensitive.
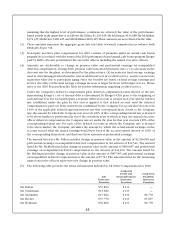
In 2010, as in all years, the Committee retained discretion to reduce the bonus payout for all executive
officers, including the named executive officers, if the Committee determined for any reason that the
bonus payouts were not appropriate. The independent directors retained that discretion for the CEO’s
bonus. Those bodies also retained discretion to adjust the targets under the plan should unanticipated
developments arise during the year. No adjustments were made to the targets. Participants under the
corporate plan, with the exception of the named executive officers, received a total bonus percentage
payout that was 1.128% greater than the payout to the named executive officers due to adjustments made
to the non-officer payouts.