Kroger 2010 Annual Report Download - page 101
Download and view the complete annual report
Please find page 101 of the 2010 Kroger annual report below. You can navigate through the pages in the report by either clicking on the pages listed below, or by using the keyword search tool below to find specific information within the annual report.-
 1
1 -
2
-
3
-
4
-
5
-
6
-
7
-
8
-
9
-
10
-
11
-
12
-
13
-
14
-
15
-
16
-
17
-
18
-
19
-
20
-
21
-
22
-
23
-
24
-
25
-
26
-
27
-
28
-
29
-
30
-
31
-
32
-
33
-
34
-
35
-
36
-
37
-
38
-
39
-
40
-
41
-
42
-
43
-
44
-
45
-
46
-
47
-
48
-
49
-
50
-
51
-
52
-
53
-
54
-
55
-
56
-
57
-
58
-
59
-
60
-
61
-
62
-
63
-
64
-
65
-
66
-
67
-
68
-
69
-
70
-
71
-
72
-
73
-
74
-
75
-
76
-
77
-
78
-
79
-
80
-
81
-
82
-
83
-
84
-
85
-
86
-
87
-
88
-
89
-
90
-
 91
91 -
 92
92 -
 93
93 -
 94
94 -
 95
95 -
 96
96 -
 97
97 -
 98
98 -
 99
99 -
 100
100 -
 101
101 -
 102
102 -
 103
103 -
 104
104 -
 105
105 -
 106
106 -
 107
107 -
 108
108 -
 109
109 -
 110
110 -
 111
111 -
112
-
113
-
114
-
115
-
116
-
117
-
118
-
119
-
120
-
121
-
122
-
123
-
124
-
125
-
126
-
127
-
128
-
129
-
130
-
131
-
132
-
133
-
134
-
135
-
136
-
137
-
138
-
139
-
140
-
141
-
142
-
143
-
144
-
145
-
146
-
147
-
148
-
149
-
150
-
151
-
152
-
153
-
154
-
155
-
156
 |
 |

A-21
Net cash used by investing activities
Cash used by investing activities was $2.0 billion in 2010, compared to $2.3 billion in 2009 and
$2.2 billion in 2008. The amount of cash used by investing activities decreased in 2010, compared to
2009, due primarily to decreased payments on capital expenditures. The amount of cash used by investing
activities increased in 2009, compared to 2008, due primarily to higher capital spending, partially offset by
decreased payments for acquisitions. Capital expenditures, including changes in construction-in-progress
payables and excluding acquisitions, were $1.9 billion in 2010, $2.3 billion in 2009 and $2.2 billion in 2008.
Refer to the Capital Expenditures section for an overview of our supermarket storing activity during the
last three years.
Net cash used by financing activities
Financing activities used $1.0 billion of cash in 2010 compared to $434 million in 2009 and $769 million
in 2008. The increase in the amount of cash used for financing activities in 2010, compared to 2009, was
primarily related to the increased payments on long-term debt and treasury stock repurchases, decreased
proceeds from the issuance of long-term debt, and an investment in the remaining interest of a variable
interest entity, partially offset by decreased payments on the credit facility. The decrease in the amount
of cash used for financing activities in 2009, compared to 2008, was primarily related to the decrease in
the amount of treasury stock purchased and payments on long-term debt and our credit facility, offset by
decreased proceeds from the issuance of long-term debt and capital stock. We repurchased $545 million
of Kroger stock in 2010 compared to $218 million in 2009 and $637 million in 2008. We paid dividends
totaling $250 million in 2010, $238 million in 2009 and $227 million in 2008.
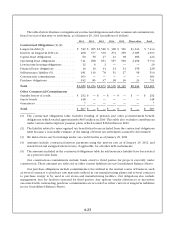
Debt Management
Total debt, including both the current and long-term portions of capital leases and lease-financing
obligations, decreased $164 million to $7.9 billion as of year-end 2010, compared to year-end 2009. The
decrease in 2010, compared to 2009, resulted from the payment at maturity of our $500 million of senior
notes bearing an interest rate of 8.05%, offset by the issuance of $300 million of senior notes bearing an
interest rate of 5.40%. Total debt decreased $7 million to $8.1 billion as of year-end 2009, compared to
year-end 2008. The decrease in 2009, compared to 2008, resulted from the payment at maturity of our
$350 million of senior notes bearing an interest rate of 7.25%, decreased outstanding commercial paper
and payments on our money market lines, offset by the issuance of $500 million of senior notes bearing an
interest rate of 3.90%.
Our total debt balances were also affected by our prefunding of employee benefit costs and by the
mark-to-market adjustments necessary to record fair value interest rate hedges on our fixed rate debt. We
had prefunded employee benefit costs of $300 million in each of the two years ended 2009 and 2008.
The mark-to-market adjustments increased the carrying value of our debt by $57 million in both 2010 and
2009.
Liquidity Needs
We estimate our liquidity needs over the next twelve month period to be approximately $2.0 billion,
which includes anticipated requirements for working capital, capital expenditures, interest payments, and
scheduled principal payments of debt, offset by cash and temporary cash investments on hand at the
end of fiscal year 2010. Based on current operating trends, we believe that cash flows from operating
activities and other sources of liquidity, including borrowings under our commercial paper program and
bank credit facility, will be adequate to meet our liquidity needs for the next twelve months and for the
foreseeable future beyond the next twelve months. In addition to the sources of liquidity noted above,