Kroger 2010 Annual Report Download - page 149
Download and view the complete annual report
Please find page 149 of the 2010 Kroger annual report below. You can navigate through the pages in the report by either clicking on the pages listed below, or by using the keyword search tool below to find specific information within the annual report.-
 1
1 -
2
-
3
-
4
-
5
-
6
-
7
-
8
-
9
-
10
-
11
-
12
-
13
-
14
-
15
-
16
-
17
-
18
-
19
-
20
-
21
-
22
-
23
-
24
-
25
-
26
-
27
-
28
-
29
-
30
-
31
-
32
-
33
-
34
-
35
-
36
-
37
-
38
-
39
-
40
-
41
-
42
-
43
-
44
-
45
-
46
-
47
-
48
-
49
-
50
-
51
-
52
-
53
-
54
-
55
-
56
-
57
-
58
-
59
-
60
-
61
-
62
-
63
-
64
-
65
-
66
-
67
-
68
-
69
-
70
-
71
-
72
-
73
-
74
-
75
-
76
-
77
-
78
-
79
-
80
-
81
-
82
-
83
-
84
-
85
-
86
-
87
-
88
-
89
-
90
-
91
-
92
-
93
-
94
-
95
-
96
-
97
-
98
-
99
-
100
-
101
-
102
-
103
-
104
-
105
-
106
-
107
-
108
-
109
-
110
-
111
-
112
-
113
-
114
-
115
-
116
-
117
-
118
-
119
-
120
-
121
-
122
-
123
-
124
-
125
-
126
-
127
-
128
-
129
-
130
-
131
-
132
-
133
-
134
-
135
-
136
-
137
-
138
-
 139
139 -
 140
140 -
 141
141 -
 142
142 -
 143
143 -
 144
144 -
 145
145 -
 146
146 -
 147
147 -
 148
148 -
 149
149 -
 150
150 -
 151
151 -
 152
152 -
 153
153 -
 154
154 -
 155
155 -
 156
156
 |
 |

A-69
NO T E S T O CO N S O L I D A T E D FI N A N C I A L ST A T E M E N T S , CO N T I N U E D
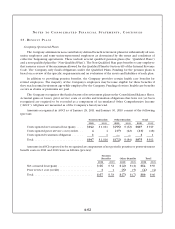
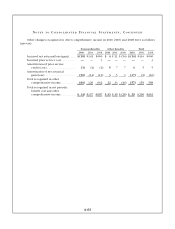
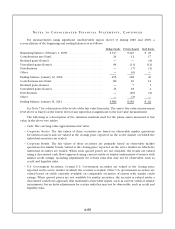
For measurements using significant unobservable inputs (Level 3) during 2010 and 2009, a
reconciliation of the beginning and ending balances is as follows:
Hedge Funds Private Equity Real Estate
Beginning balance, February 1, 2009 ....................... $347 $140 $ 49
Contributions into Fund ................................. 24 12 17
Realized gains (losses) .................................. — — (4)
Unrealized gains (losses) . . . . . . . . . . . . . . . . . . . . . . . . . . . . . . . . 84 (11) (12)
Distributions .......................................... — (7) (1)
Other ................................................ — (6) —
Ending balance, January 30, 2010 .......................... 455 128 49
Contributions into Fund ................................. 80 20 12
Realized gains (losses) .................................. — 7 1
Unrealized gains (losses) . . . . . . . . . . . . . . . . . . . . . . . . . . . . . . . . 45 18 4
Distributions .......................................... — (20) (4)
Other ................................................ — (3) —
Ending balance, January 31, 2011 .......................... $580 $150 $ 62
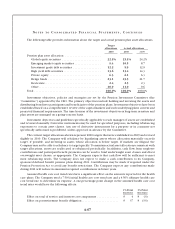
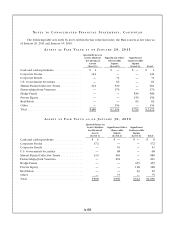
See Note 7 for a discussion of the levels of the fair value hierarchy. The assets’ fair value measurement
level above is based on the lowest level of any input that is significant to the fair value measurement.
The following is a description of the valuation methods used for the plan’s assets measured at fair
value in the above two tables:
• Cash:Thecarryingvalueapproximatesfairvalue.
• Corporate Stocks: The fair values of these securities are based on observable market quotations
for identical assets and are valued at the closing price reported on the active market on which the
individual securities are traded.
• Corporate Bonds: The fair values of these securities are primarily based on observable market
quotations for similar bonds, valued at the closing price reported on the active market on which the
individual securities are traded. When such quoted prices are not available, the bonds are valued
using a discounted cash flows approach using current yields on similar instruments of issuers with
similar credit ratings, including adjustments for certain risks that may not be observable, such as
credit and liquidity risks.
• U.S. Government Securities: Certain U.S. Government securities are valued at the closing price
reported in the active market in which the security is traded. Other U.S. government securities are
valued based on yields currently available on comparable securities of issuers with similar credit
ratings. When quoted prices are not available for similar securities, the security is valued under a
discounted cash flows approach that maximizes observable inputs, such as current yields of similar
instruments, but includes adjustments for certain risks that may not be observable, such as credit and
liquidity risks.