Kroger 2010 Annual Report Download - page 100
Download and view the complete annual report
Please find page 100 of the 2010 Kroger annual report below. You can navigate through the pages in the report by either clicking on the pages listed below, or by using the keyword search tool below to find specific information within the annual report.-
 1
1 -
2
-
3
-
4
-
5
-
6
-
7
-
8
-
9
-
10
-
11
-
12
-
13
-
14
-
15
-
16
-
17
-
18
-
19
-
20
-
21
-
22
-
23
-
24
-
25
-
26
-
27
-
28
-
29
-
30
-
31
-
32
-
33
-
34
-
35
-
36
-
37
-
38
-
39
-
40
-
41
-
42
-
43
-
44
-
45
-
46
-
47
-
48
-
49
-
50
-
51
-
52
-
53
-
54
-
55
-
56
-
57
-
58
-
59
-
60
-
61
-
62
-
63
-
64
-
65
-
66
-
67
-
68
-
69
-
70
-
71
-
72
-
73
-
74
-
75
-
76
-
77
-
78
-
79
-
80
-
81
-
82
-
83
-
84
-
85
-
86
-
87
-
88
-
89
-
 90
90 -
 91
91 -
 92
92 -
 93
93 -
 94
94 -
 95
95 -
 96
96 -
 97
97 -
 98
98 -
 99
99 -
 100
100 -
 101
101 -
 102
102 -
 103
103 -
 104
104 -
 105
105 -
 106
106 -
 107
107 -
 108
108 -
 109
109 -
 110
110 -
111
-
112
-
113
-
114
-
115
-
116
-
117
-
118
-
119
-
120
-
121
-
122
-
123
-
124
-
125
-
126
-
127
-
128
-
129
-
130
-
131
-
132
-
133
-
134
-
135
-
136
-
137
-
138
-
139
-
140
-
141
-
142
-
143
-
144
-
145
-
146
-
147
-
148
-
149
-
150
-
151
-
152
-
153
-
154
-
155
-
156
 |
 |

A-20
We follow the item-cost method of accounting to determine inventory cost before the LIFO adjustment
for substantially all store inventories at our supermarket divisions. This method involves counting each
item in inventory, assigning costs to each of these items based on the actual purchase costs (net of vendor
allowances and cash discounts) of each item and recording the cost of items sold. The item-cost method
of accounting allows for more accurate reporting of periodic inventory balances and enables management
to more precisely manage inventory and purchasing levels when compared to the methodology followed
under the retail method of accounting.
We evaluate inventory shortages throughout the year based on actual physical counts in our facilities.
We record allowances for inventory shortages based on the results of recent physical counts to provide for
estimated shortages from the last physical count to the financial statement date.
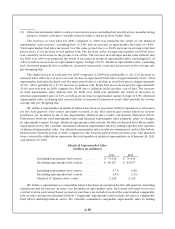
Vendor Allowances
We recognize all vendor allowances as a reduction in merchandise costs when the related product is
sold. In most cases, vendor allowances are applied to the related product cost by item, and therefore reduce
the carrying value of inventory by item. When it is not practicable to allocate vendor allowances to the
product by item, we recognize vendor allowances as a reduction in merchandise costs based on inventory
turns and as the product is sold. We recognized approximately $6.4 billion in 2010, $5.7 billion in 2009
and $5.2 billion in 2008 of vendor allowances as a reduction in merchandise costs. All years presented now
include amounts for certain vendor-funded electronic promotions. We recognized approximately 95% of all
vendor allowances in the item cost with the remainder being based on inventory turns.
LI Q U I D I T Y A N D CA P I T A L RE S O U R C E S
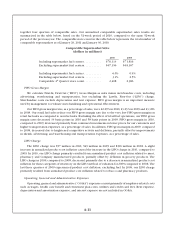
Cash Flow Information
Net cash provided by operating activities
We generated $3.4 billion of cash from operations in 2010 compared to $2.9 billion in 2009 and
2008. The cash provided by operating activities came from net earnings including noncontrolling interests
adjusted primarily for non-cash expenses of depreciation and amortization, the goodwill impairment charge,
and changes in working capital. Changes in working capital provided cash from operating activities of $698
million in 2010, compared to $(83) million in 2009 and $(421) million in 2008. The change in working
capital for 2010, compared to 2009, was primarily due to increases in trade accounts payable and accrued
expenses and a decrease in prepaid expenses. In addition, the increase in net cash provided by operating
activities in 2010, compared to 2009, was partially offset by a decrease in other long-term liabilities. Prepaid
expenses decreased in 2010, compared to 2009 and 2008, due to Kroger not prefunding $300 million of
employee benefits in 2010. The increase in the change in working capital for 2009, compared to 2008, was
primarily due to a decrease in the net income taxes receivable and payable along with a slight increase
in inventory in 2009, compared to a larger increase in inventory in 2008. These amounts are also net of
cash contributions to our Company-sponsored defined benefit pension plans totaling $141 million in 2010,
$265 million in 2009 and $20 million in 2008.
The amount of cash paid for income taxes increased in 2010, compared to 2009, due to reversals
of temporary differences in 2010 and overpayments being applied to 2009 income taxes. The amount
decreased in 2009, compared to 2008, due to applying our fiscal 2008 overpayment of income taxes to
2009 income taxes.