Kroger 2010 Annual Report Download - page 92
Download and view the complete annual report
Please find page 92 of the 2010 Kroger annual report below. You can navigate through the pages in the report by either clicking on the pages listed below, or by using the keyword search tool below to find specific information within the annual report.-
 1
1 -
2
-
3
-
4
-
5
-
6
-
7
-
8
-
9
-
10
-
11
-
12
-
13
-
14
-
15
-
16
-
17
-
18
-
19
-
20
-
21
-
22
-
23
-
24
-
25
-
26
-
27
-
28
-
29
-
30
-
31
-
32
-
33
-
34
-
35
-
36
-
37
-
38
-
39
-
40
-
41
-
42
-
43
-
44
-
45
-
46
-
47
-
48
-
49
-
50
-
51
-
52
-
53
-
54
-
55
-
56
-
57
-
58
-
59
-
60
-
61
-
62
-
63
-
64
-
65
-
66
-
67
-
68
-
69
-
70
-
71
-
72
-
73
-
74
-
75
-
76
-
77
-
78
-
79
-
80
-
81
-
 82
82 -
 83
83 -
 84
84 -
 85
85 -
 86
86 -
 87
87 -
 88
88 -
 89
89 -
 90
90 -
 91
91 -
 92
92 -
 93
93 -
 94
94 -
 95
95 -
 96
96 -
 97
97 -
 98
98 -
 99
99 -
 100
100 -
 101
101 -
 102
102 -
103
-
104
-
105
-
106
-
107
-
108
-
109
-
110
-
111
-
112
-
113
-
114
-
115
-
116
-
117
-
118
-
119
-
120
-
121
-
122
-
123
-
124
-
125
-
126
-
127
-
128
-
129
-
130
-
131
-
132
-
133
-
134
-
135
-
136
-
137
-
138
-
139
-
140
-
141
-
142
-
143
-
144
-
145
-
146
-
147
-
148
-
149
-
150
-
151
-
152
-
153
-
154
-
155
-
156
 |
 |

A-12
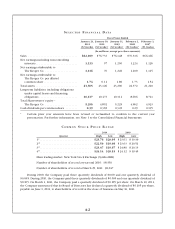
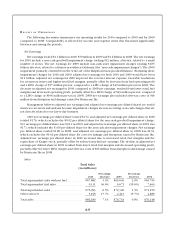
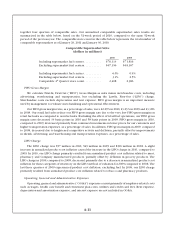
OG&Aexpenses,asapercentageofsales,were16.80%in2010,17.46%in2009and17.14%in2008.
ThegrowthinourretailfuelsalesreducesourOG&ArateduetotheverylowOG&Arateonretailfuelsales
ascomparedtonon-fuelsales.OG&Aexpenses,asapercentageofsalesexcludingfuel,decreased14basis
points in 2010, compared to 2009. The 2010 decrease, compared to 2009, resulted primarily from increased
supermarket identical sales growth, strong cost controls at the store level and reduced utility costs. These
improvements were partially offset by increases in pension and health care expenses and credit card fees.
OG&Aexpenses,asapercentageofsalesexcludingfuel,decreased3basispointsin2009,comparedto
2008. The 2009 decrease, compared to 2008, resulted primarily from increased supermarket identical
sales growth, a reduction in bag expense, lower incentive compensation, and reduced utility costs. These
improvements were partially offset by increases in credit card fees, health care costs, and wages.
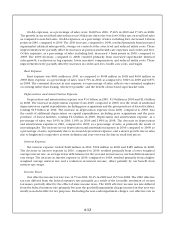
Rent Expense
Rent expense was $651 million in 2010, as compared to $648 million in 2009 and $659 million in
2008. Rent expense, as a percentage of sales, was 0.79% in 2010, as compared to 0.84% in 2009 and 0.87%
in 2008. The continual decrease in rent expense, as a percentage of sales, reflects our continued emphasis
on owning rather than leasing, whenever possible, and the benefit of increased supermarket sales.
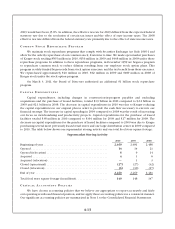
Depreciation and Amortization Expense
Depreciation and amortization expense was $1.6 billion in 2010, $1.5 billion in 2009 and $1.4 billion
in 2008. The increase in depreciation expense from 2010, compared to 2009, was the result of additional
depreciation on capital expenditures, including prior acquisitions and the prior purchase of leased facilities,
totaling $1.9 billion in 2010. The increase in depreciation expense from 2009, compared to 2008, was
the result of additional depreciation on capital expenditures, including prior acquisitions and the prior
purchase of leased facilities, totaling $2.4 billion in 2009. Depreciation and amortization expense, as a
percentage of sales, was 1.95% in 2010, 1.99% in 2009 and 1.89% in 2008. The decrease in depreciation
and amortization expense in 2010, compared to 2009, as a percentage of sales, is primarily the result of
increasing sales. The increase in our depreciation and amortization expense in 2009, compared to 2008, as
a percentage of sales, is primarily due to increased depreciation expense, and a slower growth rate in sales
due to heightened competitive activity, deflation and year-over-year decline in retail fuel prices.
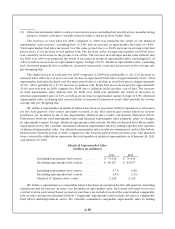
Interest Expense
Net interest expense totaled $448 million in 2010, $502 million in 2009 and $485 million in 2008.
The decrease in interest expense in 2010, compared to 2009, resulted primarily from a lower weighted
average interest rate, an average lower debt balance for the year and an increase in our benefit from interest
rate swaps. The increase in interest expense in 2009, compared to 2008, resulted primarily from a higher
weighted average interest rate and a reduction in interest income, offset partially by our benefit from
interest rate swaps.
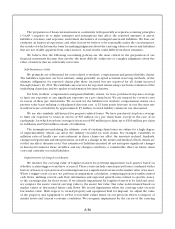
Income Taxes
Our effective income tax rate was 34.7% in 2010, 90.4% in 2009 and 36.5% in 2008. The 2010 effective
tax rate differed from the federal statutory rate primarily as a result of the favorable resolution of certain
tax issues, partially offset by the effect of state income taxes. The 2009 effective income tax rate differed
from the federal statutory rate primarily because the goodwill impairment charge incurred in that year was
mostly non-deductible for tax purposes. Excluding the non-cash impairment charges, our effective rate in