Kroger 2010 Annual Report Download - page 91
Download and view the complete annual report
Please find page 91 of the 2010 Kroger annual report below. You can navigate through the pages in the report by either clicking on the pages listed below, or by using the keyword search tool below to find specific information within the annual report.-
 1
1 -
2
-
3
-
4
-
5
-
6
-
7
-
8
-
9
-
10
-
11
-
12
-
13
-
14
-
15
-
16
-
17
-
18
-
19
-
20
-
21
-
22
-
23
-
24
-
25
-
26
-
27
-
28
-
29
-
30
-
31
-
32
-
33
-
34
-
35
-
36
-
37
-
38
-
39
-
40
-
41
-
42
-
43
-
44
-
45
-
46
-
47
-
48
-
49
-
50
-
51
-
52
-
53
-
54
-
55
-
56
-
57
-
58
-
59
-
60
-
61
-
62
-
63
-
64
-
65
-
66
-
67
-
68
-
69
-
70
-
71
-
72
-
73
-
74
-
75
-
76
-
77
-
78
-
79
-
80
-
 81
81 -
 82
82 -
 83
83 -
 84
84 -
 85
85 -
 86
86 -
 87
87 -
 88
88 -
 89
89 -
 90
90 -
 91
91 -
 92
92 -
 93
93 -
 94
94 -
 95
95 -
 96
96 -
 97
97 -
 98
98 -
 99
99 -
 100
100 -
 101
101 -
102
-
103
-
104
-
105
-
106
-
107
-
108
-
109
-
110
-
111
-
112
-
113
-
114
-
115
-
116
-
117
-
118
-
119
-
120
-
121
-
122
-
123
-
124
-
125
-
126
-
127
-
128
-
129
-
130
-
131
-
132
-
133
-
134
-
135
-
136
-
137
-
138
-
139
-
140
-
141
-
142
-
143
-
144
-
145
-
146
-
147
-
148
-
149
-
150
-
151
-
152
-
153
-
154
-
155
-
156
 |
 |

A-11
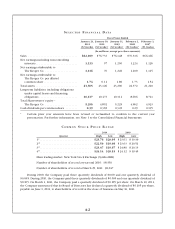
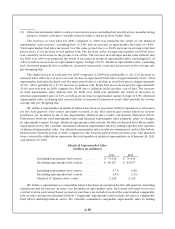
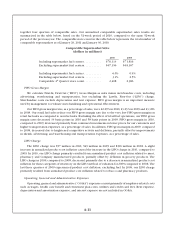
together four quarters of comparable sales. Our annualized comparable supermarket sales results are
summarized in the table below, based on the 52-week period of 2010, compared to the same 52-week
period of the previous year. The comparable store count in the table below represents the total number of
comparable supermarkets as of January 29, 2011 and January 30, 2010.
Comparable Supermarket Sales
(dollars in millions)
2010 2009
Including supermarket fuel centers . . . . . . . . . . . $76,113 $71,816
Excluding supermarket fuel centers ........... $67,156 $65,167
Including supermarket fuel centers . . . . . . . . . . . 6.0% 0.9%
Excluding supermarket fuel centers ........... 3.1% 2.5%
Comparable 4th Quarter store count ........... 2,408 2,386
FIFO Gross Margin
We calculate First-In, First-Out (“FIFO”) Gross Margin as sales minus merchandise costs, including
advertising, warehousing and transportation, but excluding the Last-In, First-Out (“LIFO”) charge.
Merchandise costs exclude depreciation and rent expense. FIFO gross margin is an important measure
used by management to evaluate merchandising and operational effectiveness.
Our FIFO gross margin rates, as a percentage of sales, were 22.29% in 2010, 23.23% in 2009 and 23.38%
in 2008. Our retail fuel sales reduce our FIFO gross margin rate due to the very low FIFO gross margin on
retail fuel sales as compared to non-fuel sales. Excluding the effect of retail fuel operations, our FIFO gross
margin rates decreased 33 basis points in 2010 and 58 basis points in 2009. FIFO gross margin in 2010,
compared to 2009, decreased primarily from continued investments in lower prices for our customers and
higher transportation expenses, as a percentage of sales. In addition, FIFO gross margin in 2009, compared
to 2008, decreased due to heightened competitive activity and deflation, partially offset by improvements
in shrink, advertising, and warehousing and transportation expenses, as a percentage of sales.
LIFO Charge
The LIFO charge was $57 million in 2010, $49 million in 2009 and $196 million in 2008. A slight
increase in annualized product cost inflation caused the increase in the LIFO charge in 2010, compared to
2009. In 2010, our LIFO charge primarily resulted from annualized product cost inflation related to meat,
pharmacy, and Company manufactured products, partially offset by deflation in grocery products. The
LIFO charge in 2009, compared to 2008, decreased primarily due to a decrease in annualized product cost
inflation for those categories of inventory on the LIFO method of valuation for 2009 compared to 2008. The
last three quarters of 2009 experienced product cost deflation, excluding fuel. In 2009, our LIFO charge
primarily resulted from annualized product cost inflation related to tobacco and pharmacy products.
Operating, General and Administrative Expenses
Operating,generalandadministrative(“OG&A”)expensesconsistprimarilyofemployee-relatedcosts
such as wages, health care benefit and retirement plan costs, utilities and credit card fees. Rent expense,
depreciationandamortizationexpense,andinterestexpensearenotincludedinOG&A.