Kroger 2010 Annual Report Download - page 146
Download and view the complete annual report
Please find page 146 of the 2010 Kroger annual report below. You can navigate through the pages in the report by either clicking on the pages listed below, or by using the keyword search tool below to find specific information within the annual report.-
 1
1 -
2
-
3
-
4
-
5
-
6
-
7
-
8
-
9
-
10
-
11
-
12
-
13
-
14
-
15
-
16
-
17
-
18
-
19
-
20
-
21
-
22
-
23
-
24
-
25
-
26
-
27
-
28
-
29
-
30
-
31
-
32
-
33
-
34
-
35
-
36
-
37
-
38
-
39
-
40
-
41
-
42
-
43
-
44
-
45
-
46
-
47
-
48
-
49
-
50
-
51
-
52
-
53
-
54
-
55
-
56
-
57
-
58
-
59
-
60
-
61
-
62
-
63
-
64
-
65
-
66
-
67
-
68
-
69
-
70
-
71
-
72
-
73
-
74
-
75
-
76
-
77
-
78
-
79
-
80
-
81
-
82
-
83
-
84
-
85
-
86
-
87
-
88
-
89
-
90
-
91
-
92
-
93
-
94
-
95
-
96
-
97
-
98
-
99
-
100
-
101
-
102
-
103
-
104
-
105
-
106
-
107
-
108
-
109
-
110
-
111
-
112
-
113
-
114
-
115
-
116
-
117
-
118
-
119
-
120
-
121
-
122
-
123
-
124
-
125
-
126
-
127
-
128
-
129
-
130
-
131
-
132
-
133
-
134
-
135
-
 136
136 -
 137
137 -
 138
138 -
 139
139 -
 140
140 -
 141
141 -
 142
142 -
 143
143 -
 144
144 -
 145
145 -
 146
146 -
 147
147 -
 148
148 -
 149
149 -
 150
150 -
 151
151 -
 152
152 -
 153
153 -
 154
154 -
 155
155 -
 156
156
 |
 |

A-66
NO T E S T O CO N S O L I D A T E D FI N A N C I A L ST A T E M E N T S , CO N T I N U E D
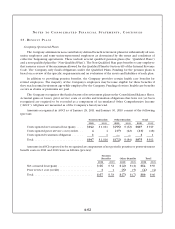
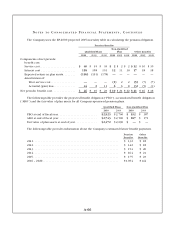
The Company uses the RP-2000 projected 2015 mortality table in calculating the pension obligation.
Pension Benefits
Qualified Plans
Non-Qualified
Plan Other Benefits
2010 2009 2008 2010 2009 2008 2010 2009 2008
Components of net periodic
benefit cost:
Service cost....................... $ 40 $ 35 $ 39 $ 2 $ 2 $ 2 $ 12 $ 10 $ 10
Interest cost ...................... 158 158 151 12 11 10 17 18 18
Expected return on plan assets........ (196) (191) (178) —— — —— —
Amortization of:
Prior service cost................ —— — (1) 2 2 (5) (7) (7)
Actuarial (gain) loss .............. 44 8 11 66 8 (3) (5) (3)
Net periodic benefit cost ............... $ 46 $ 10 $ 23 $ 19 $ 21 $ 22 $ 21 $ 16 $ 18
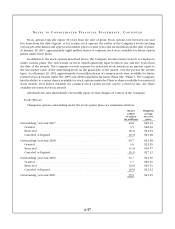
The following table provides the projected benefit obligation (“PBO”), accumulated benefit obligation
(“ABO”) and the fair value of plan assets for all Company-sponsored pension plans.
Qualified Plans Non-Qualified Plan
2010 2009 2010 2009
PBO at end of fiscal year ......................... $2,923 $ 2,706 $ 192 $ 187
ABO at end of fiscal year ......................... $2,743 $ 2,506 $ 187 $ 172
Fair value of plan assets at end of year .............. $2,472 $ 2,096 $ — $ —
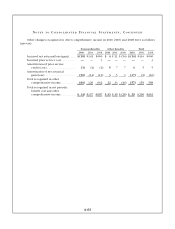
The following table provides information about the Company’s estimated future benefit payments.
Pension
Benefits
Other
Benefits
2011 ....................................................... $ 132 $ 18
2012 ....................................................... $ 142 $ 18
2013 ....................................................... $ 154 $ 20
2014 ....................................................... $ 164 $ 21
2015 ....................................................... $ 175 $ 23
2016 – 2020 ................................................. $1,054 $144