Kroger 2010 Annual Report Download - page 41
Download and view the complete annual report
Please find page 41 of the 2010 Kroger annual report below. You can navigate through the pages in the report by either clicking on the pages listed below, or by using the keyword search tool below to find specific information within the annual report.-
 1
1 -
2
-
3
-
4
-
5
-
6
-
7
-
8
-
9
-
10
-
11
-
12
-
13
-
14
-
15
-
16
-
17
-
18
-
19
-
20
-
21
-
22
-
23
-
24
-
25
-
26
-
27
-
28
-
29
-
30
-
 31
31 -
 32
32 -
 33
33 -
 34
34 -
 35
35 -
 36
36 -
 37
37 -
 38
38 -
 39
39 -
 40
40 -
 41
41 -
 42
42 -
 43
43 -
 44
44 -
 45
45 -
 46
46 -
 47
47 -
 48
48 -
 49
49 -
 50
50 -
 51
51 -
52
-
53
-
54
-
55
-
56
-
57
-
58
-
59
-
60
-
61
-
62
-
63
-
64
-
65
-
66
-
67
-
68
-
69
-
70
-
71
-
72
-
73
-
74
-
75
-
76
-
77
-
78
-
79
-
80
-
81
-
82
-
83
-
84
-
85
-
86
-
87
-
88
-
89
-
90
-
91
-
92
-
93
-
94
-
95
-
96
-
97
-
98
-
99
-
100
-
101
-
102
-
103
-
104
-
105
-
106
-
107
-
108
-
109
-
110
-
111
-
112
-
113
-
114
-
115
-
116
-
117
-
118
-
119
-
120
-
121
-
122
-
123
-
124
-
125
-
126
-
127
-
128
-
129
-
130
-
131
-
132
-
133
-
134
-
135
-
136
-
137
-
138
-
139
-
140
-
141
-
142
-
143
-
144
-
145
-
146
-
147
-
148
-
149
-
150
-
151
-
152
-
153
-
154
-
155
-
156
 |
 |

39
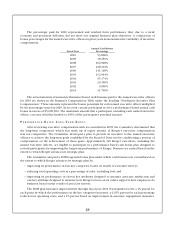
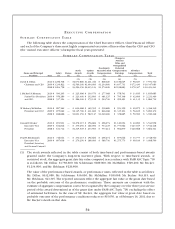
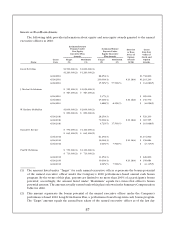
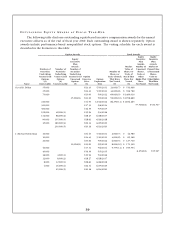
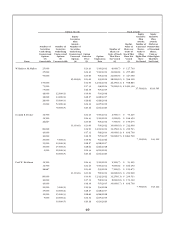
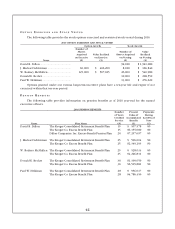
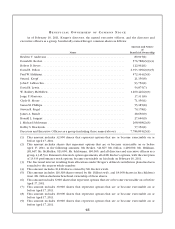
OU T S T A N D I N G EQ U I T Y AW A R D S A T FI S C A L YE A R -EN D
The following table discloses outstanding equity-based incentive compensation awards for the named
executive officers as of the end of fiscal year 2010. Each outstanding award is shown separately. Option
awards include performance-based nonqualified stock options. The vesting schedule for each award is
described in the footnotes to this table.
Option Awards Stock Awards
Name
Number of
Securities
Underlying
Unexercised
Options
(#)
Exercisable
Number of
Securities
Underlying
Unexercised
Options
(#)
Unexercisable
Equity
Incentive
Plan
Awards:
Number of
Securities
Underlying
Unexercised
Unearned
Options
(#)
Option
Exercise
Price
($)
Option
Expiration
Date
Number of
Shares or
Units of Stock
That Have
Not Vested
(#)
Market
Value of
Shares or
Units of
Stock That
Have Not
Vested
($)
Equity
Incentive
Plan
Awards:
Number of
Unearned
Shares,
Units or
Other
Rights That
Have
Not Vested
Equity
Incentive
Plan
Awards:
Market or
Payout Value
of Unearned
Shares,
Units or
Other Rights
That Have
Not Vested
David B. Dillon 35,000 $24.43 5/10/2011 24,000(7) $ 510,960
35,000 $24.43 5/10/2011 44,000(8) $ 936,760
70,000 $23.00 5/9/2012 69,000(9) $1,469,010
35,000(6) $23.00 5/9/2012 92,000(10) $1,958,680
210,000 $14.93 12/12/2012 86,250(11) $1,836,263
300,000 $17.31 5/6/2014 57,500(18) $330,527
300,000 $16.39 5/5/2015
192,000 48,000(1) $19.94 5/4/2016
132,000 88,000(2) $28.27 6/28/2017
90,000 135,000(3) $28.61 6/26/2018
45,000 180,000(4) $22.34 6/25/2019
230,000(5) $20.16 6/24/2020
J. Michael Schlotman 10,000 $24.43 5/10/2011 2,000(7) $ 42,580
10,000 $24.43 5/10/2011 4,000(8) $ 85,160
20,000 $23.00 5/9/2012 6,000(9) $ 127,740
10,000(6) $23.00 5/9/2012 8,000(10) $ 170,320
40,000 $17.31 5/6/2014 9,375(11) $ 199,594
40,000 $16.39 5/5/2015 6,250(18) $35,927
16,000 4,000(1) $19.94 5/4/2016
12,000 8,000(2) $28.27 6/28/2017
8,000 12,000(3) $28.61 6/26/2018
4,000 16,000(4) $22.34 6/25/2019
25,000(5) $20.16 6/24/2020