Kroger 2010 Annual Report Download - page 148
Download and view the complete annual report
Please find page 148 of the 2010 Kroger annual report below. You can navigate through the pages in the report by either clicking on the pages listed below, or by using the keyword search tool below to find specific information within the annual report.-
 1
1 -
2
-
3
-
4
-
5
-
6
-
7
-
8
-
9
-
10
-
11
-
12
-
13
-
14
-
15
-
16
-
17
-
18
-
19
-
20
-
21
-
22
-
23
-
24
-
25
-
26
-
27
-
28
-
29
-
30
-
31
-
32
-
33
-
34
-
35
-
36
-
37
-
38
-
39
-
40
-
41
-
42
-
43
-
44
-
45
-
46
-
47
-
48
-
49
-
50
-
51
-
52
-
53
-
54
-
55
-
56
-
57
-
58
-
59
-
60
-
61
-
62
-
63
-
64
-
65
-
66
-
67
-
68
-
69
-
70
-
71
-
72
-
73
-
74
-
75
-
76
-
77
-
78
-
79
-
80
-
81
-
82
-
83
-
84
-
85
-
86
-
87
-
88
-
89
-
90
-
91
-
92
-
93
-
94
-
95
-
96
-
97
-
98
-
99
-
100
-
101
-
102
-
103
-
104
-
105
-
106
-
107
-
108
-
109
-
110
-
111
-
112
-
113
-
114
-
115
-
116
-
117
-
118
-
119
-
120
-
121
-
122
-
123
-
124
-
125
-
126
-
127
-
128
-
129
-
130
-
131
-
132
-
133
-
134
-
135
-
136
-
137
-
 138
138 -
 139
139 -
 140
140 -
 141
141 -
 142
142 -
 143
143 -
 144
144 -
 145
145 -
 146
146 -
 147
147 -
 148
148 -
 149
149 -
 150
150 -
 151
151 -
 152
152 -
 153
153 -
 154
154 -
 155
155 -
 156
156
 |
 |

A-68
NO T E S T O CO N S O L I D A T E D FI N A N C I A L ST A T E M E N T S , CO N T I N U E D
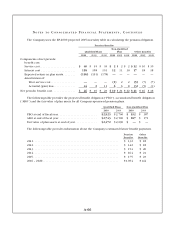
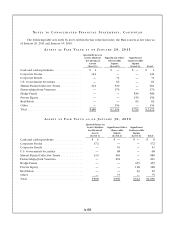
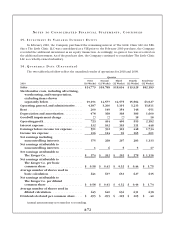
The following table sets forth by level, within the fair value hierarchy, the Plan’s assets at fair value as
of January 29, 2011 and January 30, 2010:
AS S E T S A T FA I R VA L U E A S O F JA N U A R Y 29, 2011
Quoted Prices in
Active Markets
for Identical
Assets
(Level 1)
Significant Other
Observable
Inputs
(Level 2)
Significant
Unobservable
Inputs
(Level 3) Total
Cash and cash equivalents . . . . . . . . . . . . . . . . . $ 1 $ — $ — $ 1
Corporate Stocks ......................... 324 — — 324
Corporate Bonds ......................... — 74 — 74
U.S. Government Securities . . . . . . . . . . . . . . . . — 66 — 66
Mutual Funds/Collective Trusts . . . . . . . . . . . . . 161 530 — 691
Partnerships/Joint Ventures ................ — 370 — 370
Hedge Funds ............................ — — 580 580
Private Equity ........................... — — 150 150
Real Estate .............................. — — 62 62
Other .................................. — 154 — 154
Total. . . . . . . . . . . . . . . . . . . . . . . . . . . . . . . . . . . $486 $ 1,194 $792 $ 2,472
AS S E T S A T FA I R VA L U E A S O F JA N U A R Y 30, 2010
Quoted Prices in
Active Markets
for Identical
Assets
(Level 1)
Significant Other
Observable
Inputs
(Level 2)
Significant
Unobservable
Inputs
(Level 3) Total
Cash and cash equivalents . . . . . . . . . . . . . . . . . . $ 6 $ — $ — $ 6
Corporate Stocks .......................... 372 — — 372
Corporate Bonds .......................... — 53 — 53
U.S. Government Securities . . . . . . . . . . . . . . . . . — 68 — 68
Mutual Funds/Collective Trusts . . . . . . . . . . . . . . 130 559 — 689
Partnerships/Joint Ventures ................. — 201 — 201
Hedge Funds ............................. — — 455 455
Private Equity ............................ — — 128 128
Real Estate ............................... — — 49 49
Other ................................... — 75 — 75
Total. . . . . . . . . . . . . . . . . . . . . . . . . . . . . . . . . . . . $508 $956 $632 $2,096