Kroger 2010 Annual Report Download - page 36
Download and view the complete annual report
Please find page 36 of the 2010 Kroger annual report below. You can navigate through the pages in the report by either clicking on the pages listed below, or by using the keyword search tool below to find specific information within the annual report.-
 1
1 -
2
-
3
-
4
-
5
-
6
-
7
-
8
-
9
-
10
-
11
-
12
-
13
-
14
-
15
-
16
-
17
-
18
-
19
-
20
-
21
-
22
-
23
-
24
-
25
-
 26
26 -
 27
27 -
 28
28 -
 29
29 -
 30
30 -
 31
31 -
 32
32 -
 33
33 -
 34
34 -
 35
35 -
 36
36 -
 37
37 -
 38
38 -
 39
39 -
 40
40 -
 41
41 -
 42
42 -
 43
43 -
 44
44 -
 45
45 -
 46
46 -
47
-
48
-
49
-
50
-
51
-
52
-
53
-
54
-
55
-
56
-
57
-
58
-
59
-
60
-
61
-
62
-
63
-
64
-
65
-
66
-
67
-
68
-
69
-
70
-
71
-
72
-
73
-
74
-
75
-
76
-
77
-
78
-
79
-
80
-
81
-
82
-
83
-
84
-
85
-
86
-
87
-
88
-
89
-
90
-
91
-
92
-
93
-
94
-
95
-
96
-
97
-
98
-
99
-
100
-
101
-
102
-
103
-
104
-
105
-
106
-
107
-
108
-
109
-
110
-
111
-
112
-
113
-
114
-
115
-
116
-
117
-
118
-
119
-
120
-
121
-
122
-
123
-
124
-
125
-
126
-
127
-
128
-
129
-
130
-
131
-
132
-
133
-
134
-
135
-
136
-
137
-
138
-
139
-
140
-
141
-
142
-
143
-
144
-
145
-
146
-
147
-
148
-
149
-
150
-
151
-
152
-
153
-
154
-
155
-
156
 |
 |

34
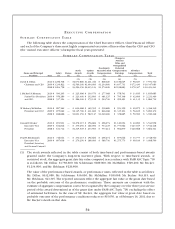
EX E C U T I V E CO M P E N S A T I O N
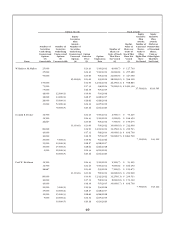
SU M M A R Y CO M P E N S A T I O N TA B L E
The following table shows the compensation of the Chief Executive Officer, Chief Financial Officer
and each of the Company’s three most highly compensated executive officers other than the CEO and CFO
(the “named executive officers”) during the fiscal years presented:
SU M M A R Y CO M P E N S A T I O N TA B L E
Name and Principal
Position Year
Salary
($)
Bonus
($)
Stock
Awards
($)
Option
Awards
($)
Non-Equity
Incentive Plan
Compensation
($)
Change in
Pension
Value and
Nonqualified
Deferred
Compensation
Earnings
($)
All Other
Compensation
($)
Total
($)
(1) (2) (3) (4) (5)
David B. Dillon
Chairman and CEO
2010
2009
2008
$
$
$
1,256,548
1,239,822
1,204,758
—
—
—
$
$
$
2,070,880
2,569,100
3,290,150
$
$
$
1,201,240
1,494,000
2,015,123
$
$
$
808,020
1,234,000
1,574,220
$
$
$
2,156,625
3,637,731
2,198,683
$
$
$
58,027
172,430
170,307
$
$
$
7,551,340
10,347,083
10,453,241
J. Michael Schlotman
Senior Vice President
and CFO
2010
2009
2008
$
$
$
590,295
556,280
537,124
—
—
—
$
$
$
225,096
223,400
286,100
$
$
$
130,570
132,800
179,122
$
$
$
277,368
461,125
524,740
$
$
$
578,541
795,146
292,491
$
$
$
13,815
42,609
41,135
$
$
$
1,815,685
2,211,360
1,860,712
W. Rodney McMullen
President and COO
2010
2009
2008
$
$
$
887,562
875,062
848,686
—
—
—
$
$
$
630,268
2,345,700
1,001,350
$
$
$
365,595
431,600
582,147
$
$
$
538,680
846,368
1,049,480
$
$
$
953,159
1,335,103
378,685
$
$
$
20,875
56,639
59,900
$
$
$
3,396,139
5,890,472
3,920,248
Donald E. Becker
Executive Vice
President
2010
2009
2008
$
$
$
651,901
632,816
611,712
—
—
—
$
$
$
1,278,115
279,250
1,215,925
$
$
$
156,684
166,000
233,903
$
$
$
296,274
534,125
577,214
$
$
$
1,120,094
1,773,062
902,879
$
$
$
40,890
127,165
120,668
$
$
$
3,543,958
3,512,418
3,662,301
Paul W. Heldman(6)
Executive Vice
President, Secretary
and General Counsel
2010
2009
$
$
716,044
697,638
—
—
$
$
270,115
279,250
$
$
156,684
166,000
$
$
296,274
580,730
$
$
875,646
1,275,773
$
$
33,777
99,199
$
$
2,348,540
3,098,590
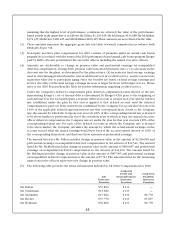
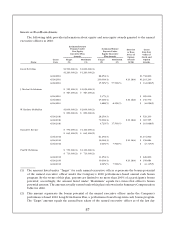
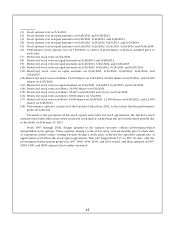
(1) The stock awards reflected in the table consist of both time-based and performance-based awards
granted under the Company’s long-term incentive plans. With respect to time-based awards, or
restricted stock, the aggregate grant date fair value computed in accordance with FASB ASC Topic 718
is as follows: Mr. Dillon: $1,738,800; Mr. Schlotman: $189,000; Mr. McMullen: $529,200; Mr. Becker:
$1,234,800; and Mr. Heldman: $226,800.
The value of the performance-based awards, or performance units, reflected in the table is as follows:
Mr. Dillon: $332,080; Mr. Schlotman: $36,096; Mr. McMullen: $101,068; Mr. Becker: $43,315; and
Mr. Heldman: $43,315. The reported amounts reflect the aggregate fair value at the grant date based
on the probable outcome of the performance conditions. These amounts are consistent with the
estimate of aggregate compensation cost to be recognized by the Company over the three-year service
period of the award determined as of the grant date under FASB ASC Topic 718, excluding the effect
of estimated forfeitures. In the case of Mr. Becker, the aggregate fair value at grant date based on
probable outcome of the performance conditions reduces to $15,056, as of February 16, 2011, due to
Mr. Becker’s death on that date.