Kroger 2010 Annual Report Download - page 31
Download and view the complete annual report
Please find page 31 of the 2010 Kroger annual report below. You can navigate through the pages in the report by either clicking on the pages listed below, or by using the keyword search tool below to find specific information within the annual report.-
 1
1 -
2
-
3
-
4
-
5
-
6
-
7
-
8
-
9
-
10
-
11
-
12
-
13
-
14
-
15
-
16
-
17
-
18
-
19
-
20
-
 21
21 -
 22
22 -
 23
23 -
 24
24 -
 25
25 -
 26
26 -
 27
27 -
 28
28 -
 29
29 -
 30
30 -
 31
31 -
 32
32 -
 33
33 -
 34
34 -
 35
35 -
 36
36 -
 37
37 -
 38
38 -
 39
39 -
 40
40 -
 41
41 -
42
-
43
-
44
-
45
-
46
-
47
-
48
-
49
-
50
-
51
-
52
-
53
-
54
-
55
-
56
-
57
-
58
-
59
-
60
-
61
-
62
-
63
-
64
-
65
-
66
-
67
-
68
-
69
-
70
-
71
-
72
-
73
-
74
-
75
-
76
-
77
-
78
-
79
-
80
-
81
-
82
-
83
-
84
-
85
-
86
-
87
-
88
-
89
-
90
-
91
-
92
-
93
-
94
-
95
-
96
-
97
-
98
-
99
-
100
-
101
-
102
-
103
-
104
-
105
-
106
-
107
-
108
-
109
-
110
-
111
-
112
-
113
-
114
-
115
-
116
-
117
-
118
-
119
-
120
-
121
-
122
-
123
-
124
-
125
-
126
-
127
-
128
-
129
-
130
-
131
-
132
-
133
-
134
-
135
-
136
-
137
-
138
-
139
-
140
-
141
-
142
-
143
-
144
-
145
-
146
-
147
-
148
-
149
-
150
-
151
-
152
-
153
-
154
-
155
-
156
 |
 |

29
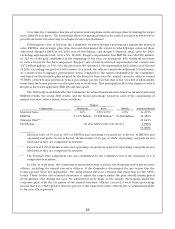
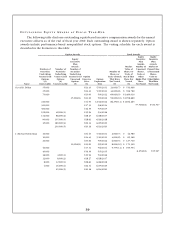
The percentage paid for 2010 represented and resulted from performance that, due to a weak
economy and persistent deflation, did not meet our original business plan objectives. A comparison of
bonus percentages for the named executive officers in prior years demonstrates the variability of incentive
compensation:
Fiscal Year
Annual Cash Bonus
Percentage
2010 53.868%
2009 38.450%
2008 104.948%
2007 128.104%
2006 141.118%
2005 132.094%
2004 55.174%
2003 24.100%
2002 9.900%
2001 31.760%
The actual amounts of annual performance-based cash bonuses paid to the named executive officers
for 2010 are shown in the Summary Compensation Table under the heading “Non-Equity Incentive Plan
Compensation.” These amounts represent the bonus potentials for each named executive officer multiplied
by the percentage earned in 2010. In no event can any participant receive a performance-based annual cash
bonus in excess of $5,000,000. The maximum amount that a participant, including each named executive
officer, can earn is further limited to 200% of the participant’s potential amount.
PE R F O R M A N C E -BA S E D LO N G -TE R M BO N U S
After reviewing executive compensation with its consultant in 2005, the Committee determined that
the long-term component, which was made up of equity awards, of Kroger’s executive compensation
was not competitive. The Committee developed a plan to provide an incentive to the named executive
officers to achieve the long-term goals established by the Board of Directors by conditioning a portion of
compensation on the achievement of those goals. Approximately 140 Kroger executives, including the
named executive officers, are eligible to participate in a performance-based cash bonus plan designed to
reward participants for improving the long-term performance of Kroger. Bonuses are earned based on the
extent to which Kroger advances its strategic plan.
The Committee adopted a 2008 long-term bonus plan under which cash bonuses are earned based on
the extent to which Kroger advances its strategic plan by:
• improvingitsperformanceinfourkeycategories,basedonresultsofcustomersurveys;
• reducingtotaloperatingcostsasapercentageofsales,excludingfuel;and
• improvingits performancein eleven key attributesdesignedtomeasure associatesatisfaction and
one key attribute designed to measure how Kroger’s focus on its values supports how employees do
business, based on the results of associate surveys.
The 2008 plan measures improvements through fiscal year 2011. Participants receive a 1% payout for
each point by which the performance in the key categories increases, a 0.25% payout for each percentage
reduction in operating costs, and a 1% payout based on improvement in associate engagement measures.