Kroger 2010 Annual Report Download - page 89
Download and view the complete annual report
Please find page 89 of the 2010 Kroger annual report below. You can navigate through the pages in the report by either clicking on the pages listed below, or by using the keyword search tool below to find specific information within the annual report.-
 1
1 -
2
-
3
-
4
-
5
-
6
-
7
-
8
-
9
-
10
-
11
-
12
-
13
-
14
-
15
-
16
-
17
-
18
-
19
-
20
-
21
-
22
-
23
-
24
-
25
-
26
-
27
-
28
-
29
-
30
-
31
-
32
-
33
-
34
-
35
-
36
-
37
-
38
-
39
-
40
-
41
-
42
-
43
-
44
-
45
-
46
-
47
-
48
-
49
-
50
-
51
-
52
-
53
-
54
-
55
-
56
-
57
-
58
-
59
-
60
-
61
-
62
-
63
-
64
-
65
-
66
-
67
-
68
-
69
-
70
-
71
-
72
-
73
-
74
-
75
-
76
-
77
-
78
-
 79
79 -
 80
80 -
 81
81 -
 82
82 -
 83
83 -
 84
84 -
 85
85 -
 86
86 -
 87
87 -
 88
88 -
 89
89 -
 90
90 -
 91
91 -
 92
92 -
 93
93 -
 94
94 -
 95
95 -
 96
96 -
 97
97 -
 98
98 -
 99
99 -
100
-
101
-
102
-
103
-
104
-
105
-
106
-
107
-
108
-
109
-
110
-
111
-
112
-
113
-
114
-
115
-
116
-
117
-
118
-
119
-
120
-
121
-
122
-
123
-
124
-
125
-
126
-
127
-
128
-
129
-
130
-
131
-
132
-
133
-
134
-
135
-
136
-
137
-
138
-
139
-
140
-
141
-
142
-
143
-
144
-
145
-
146
-
147
-
148
-
149
-
150
-
151
-
152
-
153
-
154
-
155
-
156
 |
 |

A-9
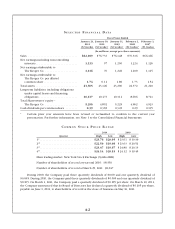
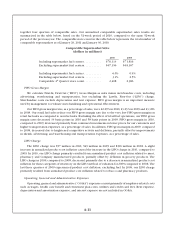
RESULTS OF OPERATIONS
The following discussion summarizes our operating results for 2010 compared to 2009 and for 2009
compared to 2008. Comparability is affected by income and expense items that fluctuated significantly
between and among the periods.
Net Earnings
Net earnings totaled $1.1 billion in 2010, $70 million in 2009 and $1.2 billion in 2008. The net earnings
for 2010 include a non-cash goodwill impairment charge totaling $12 million, after-tax, related to a small
number of stores. The net earnings for 2009 include non-cash asset impairment charges totaling $1.05
billion, after-tax, related to a division in southern California (the “non-cash impairment charges”). The 2009
impairment primarily resulted from the write-off of the Ralphs division goodwill balance. Excluding these
impairments charges for 2010 and 2009, adjusted net earnings for both 2010 and 2009 would have been
$1.1 billion. Adjusted net earnings for 2010 improved due to lower interest expense, favorable resolutions
for certain tax issues and higher retail fuel margins, partially offset by decreased non-fuel operating profit
and a LIFO charge of $57 million pre-tax, compared to a LIFO charge of $49 million pre-tax in 2009. The
decrease in adjusted net earnings for 2009, compared to 2008 net earnings, resulted from lower retail fuel
margins and decreased operating profit, partially offset by a LIFO charge of $49 million pre-tax, compared
to a LIFO charge of $196 million pre-tax in 2008. 2008 net earnings also included after-tax costs of $16
million from disruption and damage caused by Hurricane Ike.
Management believes adjusted net earnings (and adjusted net earnings per diluted share) are useful
metrics to investors and analysts because impairment charges are non-recurring, non-cash charges that are
not directly related to our day-to-day business.
2010 net earnings per diluted share totaled $1.74, and adjusted net earnings per diluted share in 2010
totaled $1.76, which excludes the $0.02 per diluted share for the non-cash goodwill impairment charge.
Net earnings per diluted share was $0.11 in 2009, and adjusted net earnings per diluted share in 2009 was
$1.71, which excludes the $1.60 per diluted share for the non-cash asset impairment charges. Net earnings
per diluted share totaled $1.89 in 2008, and adjusted net earnings per diluted share in 2008 was $1.91,
which excludes the $0.02 per diluted share for costs for damage and disruption caused by Hurricane Ike.
Adjusted net earnings per diluted share in 2010 increased due to increased retail fuel margins and the
repurchase of Kroger stock, partially offset by reduced non-fuel net earnings. The decline in adjusted net
earnings per diluted share in 2009 resulted from lower retail fuel margins and decreased operating profit,
partially offset by lower LIFO charges and after-tax costs of $16 million from disruption and damage caused
by Hurricane Ike in 2008.
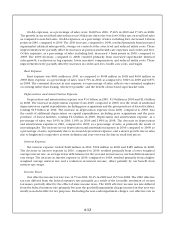
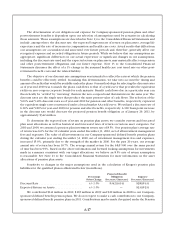
Sales
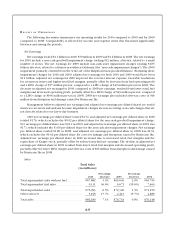
Total Sales
(in millions)
2010
Percentage
Increase 2009
Percentage
Increase 2008
Total supermarket sales without fuel .......... $67,882 3.4% $65,649 2.9% $63,795
Total supermarket fuel sales ................. 9,111 36.6% 6,671 (10.6%) 7,464
Total supermarket sales . . . . . . . . . . . . . . . . . . . . $76,993 6.5% $72,320 1.5% $71,259
Other sales (1) ............................ 5,196 17.7% 4,413 (9.7%) 4,889
Total sales . . . . . . . . . . . . . . . . . . . . . . . . . . . . . . . $82,189 7.1% $76,733 0.8% $76,148