Kroger 2010 Annual Report Download - page 145
Download and view the complete annual report
Please find page 145 of the 2010 Kroger annual report below. You can navigate through the pages in the report by either clicking on the pages listed below, or by using the keyword search tool below to find specific information within the annual report.-
 1
1 -
2
-
3
-
4
-
5
-
6
-
7
-
8
-
9
-
10
-
11
-
12
-
13
-
14
-
15
-
16
-
17
-
18
-
19
-
20
-
21
-
22
-
23
-
24
-
25
-
26
-
27
-
28
-
29
-
30
-
31
-
32
-
33
-
34
-
35
-
36
-
37
-
38
-
39
-
40
-
41
-
42
-
43
-
44
-
45
-
46
-
47
-
48
-
49
-
50
-
51
-
52
-
53
-
54
-
55
-
56
-
57
-
58
-
59
-
60
-
61
-
62
-
63
-
64
-
65
-
66
-
67
-
68
-
69
-
70
-
71
-
72
-
73
-
74
-
75
-
76
-
77
-
78
-
79
-
80
-
81
-
82
-
83
-
84
-
85
-
86
-
87
-
88
-
89
-
90
-
91
-
92
-
93
-
94
-
95
-
96
-
97
-
98
-
99
-
100
-
101
-
102
-
103
-
104
-
105
-
106
-
107
-
108
-
109
-
110
-
111
-
112
-
113
-
114
-
115
-
116
-
117
-
118
-
119
-
120
-
121
-
122
-
123
-
124
-
125
-
126
-
127
-
128
-
129
-
130
-
131
-
132
-
133
-
134
-
 135
135 -
 136
136 -
 137
137 -
 138
138 -
 139
139 -
 140
140 -
 141
141 -
 142
142 -
 143
143 -
 144
144 -
 145
145 -
 146
146 -
 147
147 -
 148
148 -
 149
149 -
 150
150 -
 151
151 -
 152
152 -
 153
153 -
 154
154 -
 155
155 -
156
 |
 |

A-65
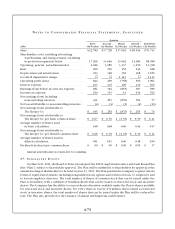
NO T E S T O CO N S O L I D A T E D FI N A N C I A L ST A T E M E N T S , CO N T I N U E D
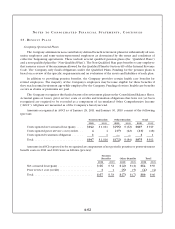
As of January 29, 2011 and January 30, 2010, pension plan assets included no shares of The Kroger Co.
common stock.
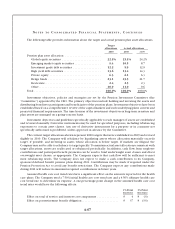
Pension Benefits Other Benefits
Weighted average assumptions 2010 2009 2008 2010 2009 2008
Discount rate – Benefit obligation . . . . . . . . . . 5.60% 6.00% 7.00% 5.40% 5.80% 7.00%
Discount rate – Net periodic benefit cost . . . . 6.00% 7.00% 6.50% 5.80% 7.00% 6.50%
Expected return on plan assets . . . . . . . . . . . . 8.50% 8.50% 8.50%
Rate of compensation increase –
Net periodic benefit cost ............... 2.92% 2.92% 2.99%
Rate of compensation increase –
Benefit Obligation . . . . . . . . . . . . . . . . . . . . 2.88% 2.92% 2.92%
The Company’s discount rate assumptions were intended to reflect the rates at which the pension
benefits could be effectively settled. They take into account the timing and amount of benefits that would
be available under the plans. The Company’s methodology for selecting the discount rates as of year-end
2010 was to match the plan’s cash flows to that of a yield curve that provides the equivalent yields on zero-
coupon corporate bonds for each maturity. Benefit cash flows due in a particular year can theoretically be
“settled” by “investing” them in the zero-coupon bond that matures in the same year. The discount rates are
the single rates that produce the same present value of cash flows. The selection of the 5.60% and 5.40%
discount rates as of year-end 2010 for pension and other benefits, respectively, represents the equivalent
single rates constructed under a broad-market AA yield curve constructed by an outside consultant. The
Company utilized a discount rate of 6.00% and 5.80% for year-end 2009 for pension and other benefits,
respectively. A 100 basis point increase in the discount rate would decrease the projected pension benefit
obligation as of January 29, 2011, by approximately $342.
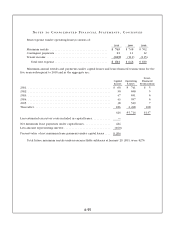
To determine the expected rate of return on pension plan assets, the Company considers current
and anticipated plan asset allocations as well as historical and forecasted rates of return on various asset
categories. For 2010, 2009 and 2008, the Company assumed a pension plan investment return rate of
8.5%. The Company pension plan’s average rate of return was 6.6% for the 10 calendar years ended
December 31, 2010, net of all investment management fees and expenses. The value of all investments in
its Company-sponsored defined benefit pension plans during the calendar year ending December 31, 2010,
net of investment management fees and expenses, increased 15.0%, primarily due to the strength of the
market in 2010. For the past 20 years, the Company average annual rate of return has been 10.7%, and the
averageannualrateofreturnfortheS&P500hasbeen9.9%.Basedontheaboveinformationandforward
looking assumptions for investments made in a manner consistent with the Company’s target allocations,
the Company believes an 8.5% rate of return assumption is reasonable.
The Company calculates its expected return on plan assets by using the market related value of plan
assets. The market related value of plan assets is determined by adjusting the actual fair value of plan assets
for unrecognized gains or losses on plan assets. Unrecognized gains or losses represent the difference
between actual and expected returns on plan investments for each plan year. Unrecognized gains or losses
on plan assets are recognized evenly over a five year period. Using a different method to calculate the
market related value of plan assets would provide a different expected return on plan assets.
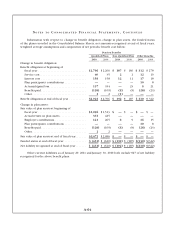
The fair value of plan assets increased in 2010 compared to 2009 due to the strength of the global
financial markets in 2010. This increase caused the Company’s underfunded status to decrease at
January 29, 2011.