Kroger 2010 Annual Report Download - page 90
Download and view the complete annual report
Please find page 90 of the 2010 Kroger annual report below. You can navigate through the pages in the report by either clicking on the pages listed below, or by using the keyword search tool below to find specific information within the annual report.-
 1
1 -
2
-
3
-
4
-
5
-
6
-
7
-
8
-
9
-
10
-
11
-
12
-
13
-
14
-
15
-
16
-
17
-
18
-
19
-
20
-
21
-
22
-
23
-
24
-
25
-
26
-
27
-
28
-
29
-
30
-
31
-
32
-
33
-
34
-
35
-
36
-
37
-
38
-
39
-
40
-
41
-
42
-
43
-
44
-
45
-
46
-
47
-
48
-
49
-
50
-
51
-
52
-
53
-
54
-
55
-
56
-
57
-
58
-
59
-
60
-
61
-
62
-
63
-
64
-
65
-
66
-
67
-
68
-
69
-
70
-
71
-
72
-
73
-
74
-
75
-
76
-
77
-
78
-
79
-
 80
80 -
 81
81 -
 82
82 -
 83
83 -
 84
84 -
 85
85 -
 86
86 -
 87
87 -
 88
88 -
 89
89 -
 90
90 -
 91
91 -
 92
92 -
 93
93 -
 94
94 -
 95
95 -
 96
96 -
 97
97 -
 98
98 -
 99
99 -
 100
100 -
101
-
102
-
103
-
104
-
105
-
106
-
107
-
108
-
109
-
110
-
111
-
112
-
113
-
114
-
115
-
116
-
117
-
118
-
119
-
120
-
121
-
122
-
123
-
124
-
125
-
126
-
127
-
128
-
129
-
130
-
131
-
132
-
133
-
134
-
135
-
136
-
137
-
138
-
139
-
140
-
141
-
142
-
143
-
144
-
145
-
146
-
147
-
148
-
149
-
150
-
151
-
152
-
153
-
154
-
155
-
156
 |
 |

A-10
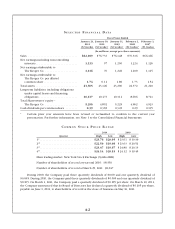
(1) Other sales primarily relate to sales at convenience stores, including fuel; jewelry stores; manufacturing
plants to outside customers; variable interest entities; and an in-store health clinic.
The increase in total sales for 2010 compared to 2009 was primarily the result of our identical
supermarket sales increase, excluding fuel, of 2.8% and an increase in supermarket fuel sales of 36.6%.
Total supermarket fuel sales increased over the same period due to a 16.8% increase in average retail fuel
prices and a 17.2% increase in fuel gallons sold. The increase in the average supermarket retail fuel price
was caused by an increase in the product cost of fuel. The increase in total supermarket sales without fuel
for 2010 over 2009 was primarily the result of increases in identical supermarket sales, excluding fuel, of
2.8% as well as an increase in supermarket square footage of 0.5%. Identical supermarket sales, excluding
fuel, increased primarily due to inflation, increased transaction count and an increase in the average sale
per shopping trip.
The slight increase in total sales for 2009 compared to 2008 was attributable to our 2.1% increase in
identical sales offset by our year-over-year decline in supermarket fuel sales of approximately 10.6%. Total
supermarket fuel sales declined over the same period due to a decline in retail fuel prices of approximately
23.6%, offset partially by a 17.2% increase in gallons sold. Retail fuel prices decreased by approximately
23.6% year-over-year in 2009 compared to 2008 due to deflation in the product cost of fuel. The increase
in total supermarket sales without fuel for 2009 over 2008 was primarily the result of increases in
identical supermarket sales of 2.1% as well as an increase in supermarket square footage of 0.8%. Identical
supermarket sales, excluding fuel, increased due to increased transaction count offset partially by a lower
average sale per shopping trip.
We define a supermarket as identical when it has been in operation without expansion or relocation
for five full quarters. Fuel center discounts received at our fuel centers and earned based on in-store
purchases are included in all of the supermarket identical sales results calculations illustrated below.
Differences between total supermarket sales and identical supermarket sales primarily relate to changes
in supermarket square footage. Identical supermarket sales include all sales at identical Fred Meyer multi-
department stores. We calculate annualized identical supermarket sales by adding together four quarters
of identical supermarket sales. Our identical supermarket sales results are summarized in the table below,
based on the 52-week period of 2010, compared to the 52-week period of the previous year. The identical
store count in the table below represents the total number of identical supermarkets as of January 29, 2011
and January 30, 2010.
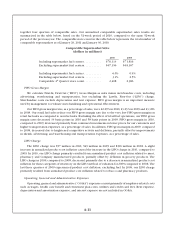
Identical Supermarket Sales
(dollars in millions)
2010 2009
Including supermarket fuel centers . . . . . . . . . . . $ 74,144 $ 70,154
Excluding supermarket fuel centers ........... $ 65,427 $ 63,637
Including supermarket fuel centers . . . . . . . . . . . 5.7 % 0.6%
Excluding supermarket fuel centers ........... 2.8 % 2.1%
Identical 4th Quarter store count ............. 2,342 2,325
We define a supermarket as comparable when it has been in operation for five full quarters, including
expansions and relocations. As is the case for identical supermarket sales, fuel center discounts received at
our fuel centers and earned based on in-store purchases are included in all of the supermarket comparable
sales results calculations illustrated below. Comparable supermarket sales include all sales at comparable
Fred Meyer multi-department stores. We calculate annualized comparable supermarket sales by adding