Honeywell 2011 Annual Report Download - page 89
Download and view the complete annual report
Please find page 89 of the 2011 Honeywell annual report below. You can navigate through the pages in the report by either clicking on the pages listed below, or by using the keyword search tool below to find specific information within the annual report.-
 1
1 -
2
-
3
-
4
-
5
-
6
-
7
-
8
-
9
-
10
-
11
-
12
-
13
-
14
-
15
-
16
-
17
-
18
-
19
-
20
-
21
-
22
-
23
-
24
-
25
-
26
-
27
-
28
-
29
-
30
-
31
-
32
-
33
-
34
-
35
-
36
-
37
-
38
-
39
-
40
-
41
-
42
-
43
-
44
-
45
-
46
-
47
-
48
-
49
-
50
-
51
-
52
-
53
-
54
-
55
-
56
-
57
-
58
-
59
-
60
-
61
-
62
-
63
-
64
-
65
-
66
-
67
-
68
-
69
-
70
-
71
-
72
-
73
-
74
-
75
-
76
-
77
-
78
-
 79
79 -
 80
80 -
 81
81 -
 82
82 -
 83
83 -
 84
84 -
 85
85 -
 86
86 -
 87
87 -
 88
88 -
 89
89 -
 90
90 -
 91
91 -
 92
92 -
 93
93 -
 94
94 -
 95
95 -
 96
96 -
 97
97 -
 98
98 -
 99
99 -
100
-
101
-
102
-
103
-
104
-
105
-
106
-
107
-
108
-
109
-
110
-
111
-
112
-
113
-
114
-
115
-
116
-
117
-
118
-
119
-
120
-
121
-
122
-
123
-
124
-
125
-
126
-
127
-
128
-
129
-
130
-
131
-
132
-
133
-
134
-
135
-
136
-
137
-
138
-
139
-
140
-
141
-
142
-
143
-
144
-
145
-
146
-
147
-
148
-
149
-
150
-
151
-
152
-
153
-
154
-
155
-
156
-
157
-
158
-
159
 |
 |

Number of
Options
Weighted
Average
Exercise
Price
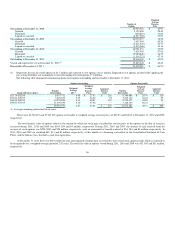
Outstanding at December 31, 2008 40,933,522 $ 43.97
Granted 9,159,650 28.40
Exercised (645,201) 31.66
Lapsed or canceled (8,537,598) 53.90
Outstanding at December 31, 2009 40,910,373 38.58
Granted 7,607,950 40.29
Exercised (5,211,526) 34.77
Lapsed or canceled (2,515,266) 44.14
Outstanding at December 31, 2010 40,791,531 39.05
Granted 7,625,950 57.08
Exercised (7,984,840) 36.39
Lapsed or canceled (1,516,271) 42.38
Outstanding at December 31, 2011 38,916,370 $ 43.01
Vested and expected to vest at December 31, 2011(1) 35,845,642 $ 42.49
Exercisable at December 31, 2011 21,672,281 $ 40.71
(1) Represents the sum of vested options of 21.7 million and expected to vest options of 14.1 million. Expected to vest options are derived by applying the
pre-vesting forfeiture rate assumption to total outstanding unvested options 17.2 million.
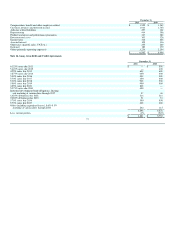
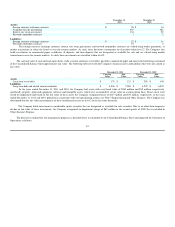
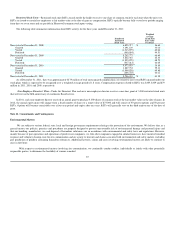
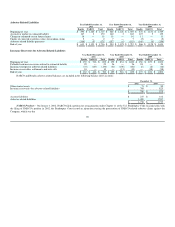
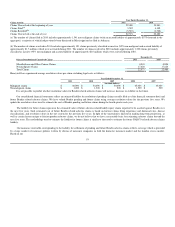
The following table summarizes information about stock options outstanding and exercisable at December 31, 2011:
Options Outstanding Options Exercisable
Range of Exercise prices Number
Outstanding
Weighted
Average
Life(1)
Weighted
Average
Exercise
Price
Aggregate
Intrinsic
Value Number
Exercisable
Weighted
Average
Exercise
Price
Aggregate
Intrinsic
Value
$21.75–$32.99 8,037,712 5.90 $ 27.53 $ 216 4,346,486 $ 26.79 $ 120
$33.00–$39.99 5,219,120 2.75 36.22 95 5,219,120 36.22 95
$40.00–$49.99 14,259,988 6.31 42.61 167 8,978,375 43.96 93
$50.00–$74.95 11,399,550 8.10 57.52 — 3,128,300 58.23 —
38,916,370 6.27 43.01 $ 478 21,672,281 40.71 $ 308
(1) Average remaining contractual life in years.
There were 24,722,493 and 27,427,023 options exercisable at weighted average exercise prices of $39.43 and $38.85 at December 31, 2010 and 2009,
respectively.
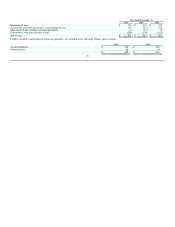
The total intrinsic value of options (which is the amount by which the stock price exceeded the exercise price of the options on the date of exercise)
exercised during 2011, 2010 and 2009 was $164, $54 and $4 million, respectively. During 2011, 2010 and 2009, the amount of cash received from the
exercise of stock options was $290, $181 and $20 million, respectively, with an associated tax benefit realized of $54, $18 and $1 million, respectively. In
2011, 2010 and 2009 we classified $42, $13 and $1 million, respectively, of this benefit as a financing cash inflow in the Consolidated Statement of Cash
Flows, and the balance was classified as cash from operations.
At December 31, 2011 there was $119 million of total unrecognized compensation cost related to non-vested stock option awards which is expected to
be recognized over a weighted-average period of 2.52 years. The total fair value of options vested during 2011, 2010 and 2009 was $52, $41 and $51 million,
respectively.
86