Honeywell 2011 Annual Report Download - page 77
Download and view the complete annual report
Please find page 77 of the 2011 Honeywell annual report below. You can navigate through the pages in the report by either clicking on the pages listed below, or by using the keyword search tool below to find specific information within the annual report.-
 1
1 -
2
-
3
-
4
-
5
-
6
-
7
-
8
-
9
-
10
-
11
-
12
-
13
-
14
-
15
-
16
-
17
-
18
-
19
-
20
-
21
-
22
-
23
-
24
-
25
-
26
-
27
-
28
-
29
-
30
-
31
-
32
-
33
-
34
-
35
-
36
-
37
-
38
-
39
-
40
-
41
-
42
-
43
-
44
-
45
-
46
-
47
-
48
-
49
-
50
-
51
-
52
-
53
-
54
-
55
-
56
-
57
-
58
-
59
-
60
-
61
-
62
-
63
-
64
-
65
-
66
-
 67
67 -
 68
68 -
 69
69 -
 70
70 -
 71
71 -
 72
72 -
 73
73 -
 74
74 -
 75
75 -
 76
76 -
 77
77 -
 78
78 -
 79
79 -
 80
80 -
 81
81 -
 82
82 -
 83
83 -
 84
84 -
 85
85 -
 86
86 -
 87
87 -
88
-
89
-
90
-
91
-
92
-
93
-
94
-
95
-
96
-
97
-
98
-
99
-
100
-
101
-
102
-
103
-
104
-
105
-
106
-
107
-
108
-
109
-
110
-
111
-
112
-
113
-
114
-
115
-
116
-
117
-
118
-
119
-
120
-
121
-
122
-
123
-
124
-
125
-
126
-
127
-
128
-
129
-
130
-
131
-
132
-
133
-
134
-
135
-
136
-
137
-
138
-
139
-
140
-
141
-
142
-
143
-
144
-
145
-
146
-
147
-
148
-
149
-
150
-
151
-
152
-
153
-
154
-
155
-
156
-
157
-
158
-
159
 |
 |

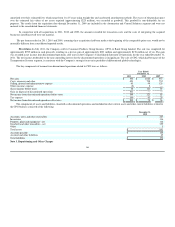
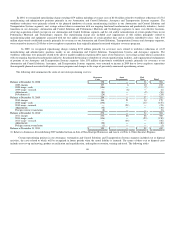
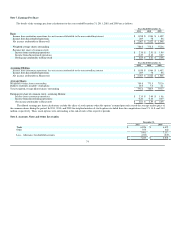
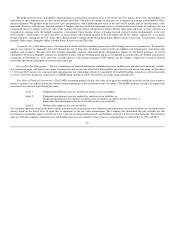
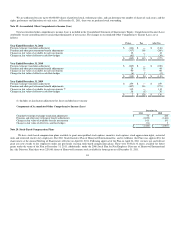
Note 7. Earnings Per Share
The details of the earnings per share calculations for the years ended December 31, 2011, 2010 and 2009 are as follows:
Years Ended December 31,
2011 2010 2009
Basic
Income from continuing operations less net income attributable to the non controlling interest $ 1,858 $ 1,944 $ 1,492
Income from discontinued operations 209 78 56
Net income attributable to Honeywell $ 2,067 $ 2,022 $ 1,548
Weighted average shares outstanding 780.8 773.5 752.6
Earnings per share of common stock:
Income from continuing operations $ 2.38 $ 2.51 $ 1.99
Income from discontinued operations 0.27 0.10 0.07
Net Income attributable to Honeywell $ 2.65 $ 2.61 $ 2.06
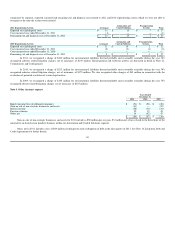
Years Ended December 31,
2011 2010 2009
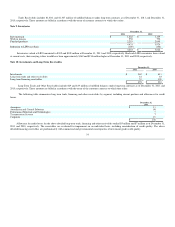
Assuming Dilution
Income from continuing operations less net income attributable to the noncontrolling interest $ 1,858 $ 1,944 $ 1,492
Income from discontinued operations 209 78 56
Net income attributable to Honeywell $ 2,067 $ 2,022 $ 1,548
Average Shares
Weighted average shares outstanding 780.8 773.5 752.6
Dilutive securities issuable - stock plans 10.8 7.4 3.1
Total weighted average diluted shares outstanding 791.6 780.9 755.7
Earnings per share of common stock - assuming dilution:
Income from continuing operations $ 2.35 $ 2.49 $ 1.98
Income from discontinuing operations 0.26 0.10 0.07
Net income attributable to Honeywell $ 2.61 $ 2.59 $ 2.05
The diluted earnings per share calculations exclude the effect of stock options when the options' assumed proceeds exceed the average market price of
the common shares during the period. In 2011, 2010, and 2009 the weighted number of stock options excluded from the computations were 9.5, 14.8, and 34.0
million, respectively. These stock options were outstanding at the end of each of the respective periods.
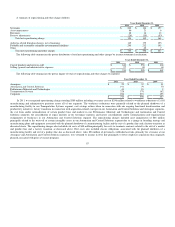
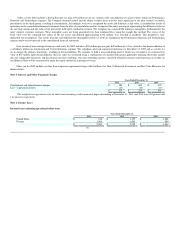
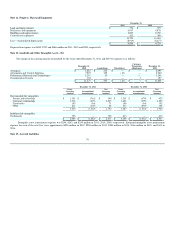
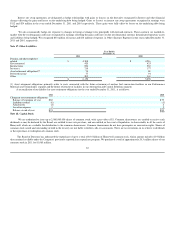
Note 8. Accounts, Notes and Other Receivables
December 31,
2011 2010
Trade $ 6,926 $ 6,471
Other 555 642
7,481 7,113
Less - Allowance for doubtful accounts (253) (272)
$ 7,228 $ 6,841
74