Honeywell 2011 Annual Report Download - page 114
Download and view the complete annual report
Please find page 114 of the 2011 Honeywell annual report below. You can navigate through the pages in the report by either clicking on the pages listed below, or by using the keyword search tool below to find specific information within the annual report.-
 1
1 -
2
-
3
-
4
-
5
-
6
-
7
-
8
-
9
-
10
-
11
-
12
-
13
-
14
-
15
-
16
-
17
-
18
-
19
-
20
-
21
-
22
-
23
-
24
-
25
-
26
-
27
-
28
-
29
-
30
-
31
-
32
-
33
-
34
-
35
-
36
-
37
-
38
-
39
-
40
-
41
-
42
-
43
-
44
-
45
-
46
-
47
-
48
-
49
-
50
-
51
-
52
-
53
-
54
-
55
-
56
-
57
-
58
-
59
-
60
-
61
-
62
-
63
-
64
-
65
-
66
-
67
-
68
-
69
-
70
-
71
-
72
-
73
-
74
-
75
-
76
-
77
-
78
-
79
-
80
-
81
-
82
-
83
-
84
-
85
-
86
-
87
-
88
-
89
-
90
-
91
-
92
-
93
-
94
-
95
-
96
-
97
-
98
-
99
-
100
-
101
-
102
-
103
-
 104
104 -
 105
105 -
 106
106 -
 107
107 -
 108
108 -
 109
109 -
 110
110 -
 111
111 -
 112
112 -
 113
113 -
 114
114 -
 115
115 -
 116
116 -
 117
117 -
 118
118 -
 119
119 -
 120
120 -
 121
121 -
 122
122 -
 123
123 -
 124
124 -
125
-
126
-
127
-
128
-
129
-
130
-
131
-
132
-
133
-
134
-
135
-
136
-
137
-
138
-
139
-
140
-
141
-
142
-
143
-
144
-
145
-
146
-
147
-
148
-
149
-
150
-
151
-
152
-
153
-
154
-
155
-
156
-
157
-
158
-
159
 |
 |

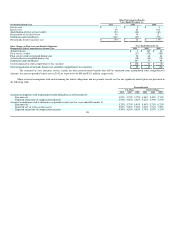
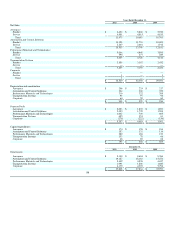
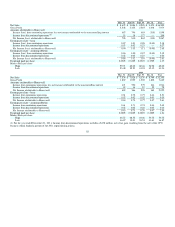
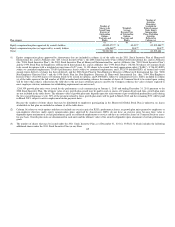
2011
Mar. 31 June 30 Sept. 30 Dec. 31 Year
Net Sales $ 8,672 $ 9,086 $ 9,298 $ 9,473 $ 36,529
Gross Profit 2,248 2,422 2,265 1,038 7,973
Amounts attributable to Honeywell
Income (loss) from continuing operations less net income attributable to the noncontrolling interest 687 796 685 (310) 1,858
Income from discontinued operations(1) 18 14 177 — 209
Net Income (loss) attributable to Honeywell 705 810 862 (310) 2,067
Earnings per share - basic
Income (loss) from continuing operations 0.87 1.01 0.88 (0.40) 2.38
Income from discontinued operations 0.03 0.02 0.23 — 0.27
Net Income (loss) attributable to Honeywell 0.90 1.03 1.11 (0.40) 2.65
Earnings per share - assuming dilution
Income (loss) from continuing operations 0.86 1.00 0.87 (0.40) 2.35
Income from discontinued operations 0.02 0.02 0.23 — 0.26
Net Income (loss) attributable to Honeywell 0.88 1.02 1.10 (0.40) 2.61
Dividends paid per share 0.3325 0.3325 0.3325 0.3725 1.37
Market Price per share
High 59.71 62.00 60.44 54.98 62.00
Low 53.48 55.53 41.94 42.32 41.94
2010
Mar. 31 June 30 Sept. 30 Dec. 31 Year
Net Sales $ 7,536 $ 7,926 $ 8,139 $ 8,749 $ 32,350
Gross Profit 1,869 1,959 1,969 1,832 7,629
Amounts attributable to Honeywell
Income from continuing operations less net income attributable to the noncontrolling interest 471 550 579 344 1,944
Income from discontinued operations 18 16 19 25 78
Net Income attributable to Honeywell 489 566 598 369 2,022
Earnings per share - basic
Income from continuing operations 0.61 0.72 0.75 0.44 2.51
Income from discontinued operations 0.02 0.02 0.02 0.03 0.10
Net Income attributable to Honeywell 0.63 0.74 0.77 0.47 2.61
Earnings per share - assuming dilution
Income from continuing operations 0.61 0.71 0.74 0.44 2.49
Income from discontinued operations 0.02 0.02 0.02 0.03 0.10
Net Income attributable to Honeywell 0.63 0.73 0.76 0.47 2.59
Dividends paid per share 0.3025 0.3025 0.3025 0.3025 1.21
Market Price per share
High 45.27 48.52 44.46 53.72 53.72
Low 36.87 39.03 38.53 43.61 36.87
(1) For the year ended December 31, 2011, Income from discontinued operations includes a $178 million, net of tax gain, resulting from the sale of the CPG
business which funded a portion of the 2011 repositioning actions.
111