Honeywell 2011 Annual Report Download - page 46
Download and view the complete annual report
Please find page 46 of the 2011 Honeywell annual report below. You can navigate through the pages in the report by either clicking on the pages listed below, or by using the keyword search tool below to find specific information within the annual report.-
 1
1 -
2
-
3
-
4
-
5
-
6
-
7
-
8
-
9
-
10
-
11
-
12
-
13
-
14
-
15
-
16
-
17
-
18
-
19
-
20
-
21
-
22
-
23
-
24
-
25
-
26
-
27
-
28
-
29
-
30
-
31
-
32
-
33
-
34
-
35
-
 36
36 -
 37
37 -
 38
38 -
 39
39 -
 40
40 -
 41
41 -
 42
42 -
 43
43 -
 44
44 -
 45
45 -
 46
46 -
 47
47 -
 48
48 -
 49
49 -
 50
50 -
 51
51 -
 52
52 -
 53
53 -
 54
54 -
 55
55 -
 56
56 -
57
-
58
-
59
-
60
-
61
-
62
-
63
-
64
-
65
-
66
-
67
-
68
-
69
-
70
-
71
-
72
-
73
-
74
-
75
-
76
-
77
-
78
-
79
-
80
-
81
-
82
-
83
-
84
-
85
-
86
-
87
-
88
-
89
-
90
-
91
-
92
-
93
-
94
-
95
-
96
-
97
-
98
-
99
-
100
-
101
-
102
-
103
-
104
-
105
-
106
-
107
-
108
-
109
-
110
-
111
-
112
-
113
-
114
-
115
-
116
-
117
-
118
-
119
-
120
-
121
-
122
-
123
-
124
-
125
-
126
-
127
-
128
-
129
-
130
-
131
-
132
-
133
-
134
-
135
-
136
-
137
-
138
-
139
-
140
-
141
-
142
-
143
-
144
-
145
-
146
-
147
-
148
-
149
-
150
-
151
-
152
-
153
-
154
-
155
-
156
-
157
-
158
-
159
 |
 |

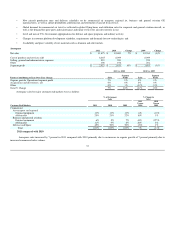
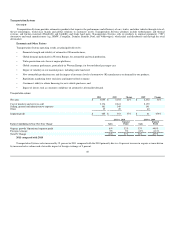
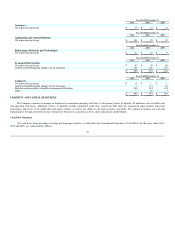
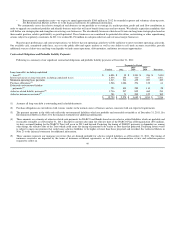
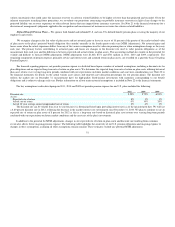
2011 2010 2009
Cash provided by (used for):
Operating activities $ 2,833 $ 4,203 $ 3,946
Investing activities (611) (2,269) (1,133)
Financing activities (1,114) (2,047) (2,152)
Effect of exchange rate changes on cash (60) (38) 75
Net increase/(decrease) in cash and cash equivalents $ 1,048 $ (151) $ 736
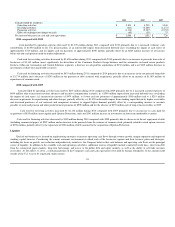
2011 compared with 2010
Cash provided by operating activities decreased by $1,370 million during 2011 compared with 2010 primarily due to i) increased voluntary cash
contributions of $1,050 million to our U.S. pension plans, ii) an unfavorable impact from decreased deferred taxes (excluding the impact of cash taxes) of
approximately $710 million, and iii) higher cash tax payments of approximately $500 million, partially offset by an $863 million increase of net income
before the non-cash pension mark-to-market adjustment.
Cash used for investing activities decreased by $1,658 million during 2011 compared with 2010 primarily due to an increase in proceeds from sale of
businesses of $1,149 million (most significantly the divestiture of the Consumer Products Group business and the automotive on-board sensor products
business within our Automation and Control Solutions segment), a decrease in cash paid for acquisitions of $330 million, and a net $315 million decrease in
investments of short-term marketable securities.
Cash used for financing activities decreased by $933 million during 2011 compared to 2010 primarily due to an increase in the net proceeds from debt
of $1,734 million and a decrease of $293 million in the payment of debt assumed with acquisitions, partially offset by an increase of $1,085 million of
repurchases of common stock.
2010 compared with 2009
Cash provided by operating activities increased by $257 million during 2010 compared with 2009 primarily due to i) increased accrued expenses of
$690 million (due to increased customer advances and incentive compensation accruals), ii) a $550 million impact from increased deferred taxes (excluding
the impact of cash taxes), iii) increased net income of $474 million, iv) lower cash tax payments of approximately $300 million and v) a $219 million
decrease in payments for repositioning and other charges, partially offset by a i) $1,059 unfavorable impact from working capital driven by higher receivables
and increased purchases of raw materials and component inventory to support higher demand, partially offset by a corresponding increase to accounts
payable, ii) increased pension and other postretirement payments of $598 million and iii) the absence of $155 million sale of long-term receivables in 2009.
Cash used for investing activities increased by $1,136 million during 2010 compared with 2009 primarily due to an increase in cash paid for
acquisitions of $835 million (most significantly Sperian Protection), and a net $341 million increase in investments in short-term marketable securities
Cash used for financing activities decreased by $105 million during 2010 compared with 2009 primarily due to a decrease in the net repayment of debt
(including commercial paper) of $287 million and an increase in the proceeds from the issuance of common stock, primarily related to stock option exercises
of $158 million, partially offset by the repayment of $326 million of debt assumed in the acquisition of Sperian Protection.
Liquidity
Each of our businesses is focused on implementing strategies to increase operating cash flows through revenue growth, margin expansion and improved
working capital turnover. Considering the current economic environment in which each of the businesses operate and their business plans and strategies,
including the focus on growth, cost reduction and productivity initiatives, the Company believes that cash balances and operating cash flows are the principal
source of liquidity. In addition to the available cash and operating cash flows, additional sources of liquidity include committed credit lines, short term debt
from the commercial paper markets, long-term borrowings, and access to the public debt and equity markets, as well as the ability to sell trade accounts
receivables. At December 31, 2011, a substantial portion of the Company's cash and cash equivalents were held by foreign subsidiaries. If the amounts held
outside of the U.S. were to be repatriated, under current
43