Honeywell 2011 Annual Report Download - page 107
Download and view the complete annual report
Please find page 107 of the 2011 Honeywell annual report below. You can navigate through the pages in the report by either clicking on the pages listed below, or by using the keyword search tool below to find specific information within the annual report.-
 1
1 -
2
-
3
-
4
-
5
-
6
-
7
-
8
-
9
-
10
-
11
-
12
-
13
-
14
-
15
-
16
-
17
-
18
-
19
-
20
-
21
-
22
-
23
-
24
-
25
-
26
-
27
-
28
-
29
-
30
-
31
-
32
-
33
-
34
-
35
-
36
-
37
-
38
-
39
-
40
-
41
-
42
-
43
-
44
-
45
-
46
-
47
-
48
-
49
-
50
-
51
-
52
-
53
-
54
-
55
-
56
-
57
-
58
-
59
-
60
-
61
-
62
-
63
-
64
-
65
-
66
-
67
-
68
-
69
-
70
-
71
-
72
-
73
-
74
-
75
-
76
-
77
-
78
-
79
-
80
-
81
-
82
-
83
-
84
-
85
-
86
-
87
-
88
-
89
-
90
-
91
-
92
-
93
-
94
-
95
-
96
-
 97
97 -
 98
98 -
 99
99 -
 100
100 -
 101
101 -
 102
102 -
 103
103 -
 104
104 -
 105
105 -
 106
106 -
 107
107 -
 108
108 -
 109
109 -
 110
110 -
 111
111 -
 112
112 -
 113
113 -
 114
114 -
 115
115 -
 116
116 -
 117
117 -
118
-
119
-
120
-
121
-
122
-
123
-
124
-
125
-
126
-
127
-
128
-
129
-
130
-
131
-
132
-
133
-
134
-
135
-
136
-
137
-
138
-
139
-
140
-
141
-
142
-
143
-
144
-
145
-
146
-
147
-
148
-
149
-
150
-
151
-
152
-
153
-
154
-
155
-
156
-
157
-
158
-
159
 |
 |

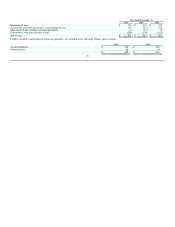
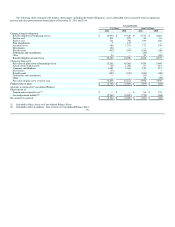
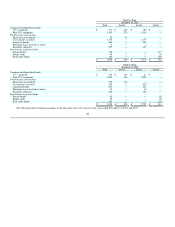
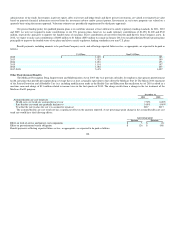
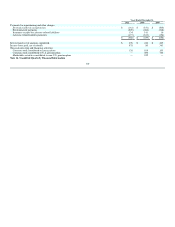
Non-U.S. Plans
December 31, 2011
Total Level 1 Level 2 Level 3
Common stock/preferred stock:
U.S. companies $ 371 $ 249 $ 122 $ —
Non-U.S. companies 1,343 233 1,110 —
Fixed income investments:
Short-term investments 78 78 — —
Government securities 1,175 — 1,175 —
Corporate bonds 463 — 463 —
Mortgage/Asset-backed securities 5 — 5 —
Insurance contracts 197 — 197 —
Investments in private funds:
Private funds 112 — — 112
Hedge funds 54 — — 54
Real estate funds 160 — — 160
$ 3,958 $ 560 $ 3,072 $ 326
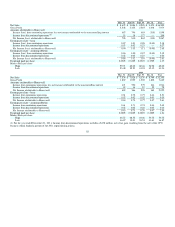
Non-U.S. Plans
December 31, 2010
Total Level 1 Level 2 Level 3
Common stock/preferred stock:
U.S. companies $ 338 $ 327 $ 11 $ —
Non-U.S. companies 1,556 336 1,220 —
Fixed income investments:
Short-term investments 176 176 — —
Government securities 915 — 915 —
Corporate bonds 431 — 431 —
Mortgage/Asset-backed securities 14 — 14 —
Insurance contracts 196 — 196 —
Investments in private funds:
Private funds 89 — — 89
Hedge funds 55 — — 55
Real estate funds 169 — — 169
$ 3,939 $ 839 $ 2,787 $ 313
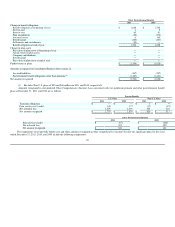
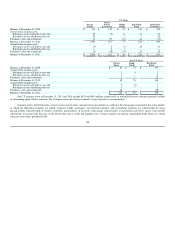
The following tables summarize changes in the fair value of Level 3 assets for the years ended December 31, 2011 and 2010:
104