Honeywell 2011 Annual Report Download - page 55
Download and view the complete annual report
Please find page 55 of the 2011 Honeywell annual report below. You can navigate through the pages in the report by either clicking on the pages listed below, or by using the keyword search tool below to find specific information within the annual report.-
 1
1 -
2
-
3
-
4
-
5
-
6
-
7
-
8
-
9
-
10
-
11
-
12
-
13
-
14
-
15
-
16
-
17
-
18
-
19
-
20
-
21
-
22
-
23
-
24
-
25
-
26
-
27
-
28
-
29
-
30
-
31
-
32
-
33
-
34
-
35
-
36
-
37
-
38
-
39
-
40
-
41
-
42
-
43
-
44
-
 45
45 -
 46
46 -
 47
47 -
 48
48 -
 49
49 -
 50
50 -
 51
51 -
 52
52 -
 53
53 -
 54
54 -
 55
55 -
 56
56 -
 57
57 -
 58
58 -
 59
59 -
 60
60 -
 61
61 -
 62
62 -
 63
63 -
 64
64 -
 65
65 -
66
-
67
-
68
-
69
-
70
-
71
-
72
-
73
-
74
-
75
-
76
-
77
-
78
-
79
-
80
-
81
-
82
-
83
-
84
-
85
-
86
-
87
-
88
-
89
-
90
-
91
-
92
-
93
-
94
-
95
-
96
-
97
-
98
-
99
-
100
-
101
-
102
-
103
-
104
-
105
-
106
-
107
-
108
-
109
-
110
-
111
-
112
-
113
-
114
-
115
-
116
-
117
-
118
-
119
-
120
-
121
-
122
-
123
-
124
-
125
-
126
-
127
-
128
-
129
-
130
-
131
-
132
-
133
-
134
-
135
-
136
-
137
-
138
-
139
-
140
-
141
-
142
-
143
-
144
-
145
-
146
-
147
-
148
-
149
-
150
-
151
-
152
-
153
-
154
-
155
-
156
-
157
-
158
-
159
 |
 |

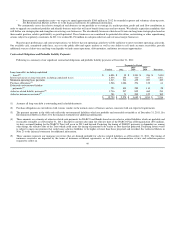
Change in Assumption
Impact on 2012
On-Going
Pension Expense Impact on PBO
0.25 percentage point decrease in discount rate Decrease $10 million Increase $410 million
0.25 percentage point increase in discount rate Increase $8 million Decrease $400 million
0.25 percentage point decrease in expected rate of return on assets Increase $32 million —
0.25 percentage point increase in expected rate of return on assets Decrease $32 million —
On-going pension expense for all of our pension plans is expected to be approximately $60 million in 2012, a decrease of $45 million from 2011, due
primarily to the impact of planned cash contributions in 2012. Also, if required, an MTM adjustment will be recorded in the fourth quarter of 2012 in
accordance with our pension accounting method as previously described. It is difficult to reliably forecast or predict whether there will be a MTM adjustment
in 2012, and if one is required what the magnitude of such adjustment will be. MTM adjustments are primarily driven by events and circumstances beyond the
control of the Company such as changes in interest rates and the performance of the financial markets.
In 2011, 2010 and 2009,we were not required to make contributions to satisfy minimum statutory funding requirements in our U.S. pension plans.
However, we made voluntary contributions of $1,650, $1,000 and $740 million to our U.S. pension plans in 2011, 2010 and 2009, respectively, primarily to
improve the funded status of our plans which has been adversely impacted by relatively low discount rates and asset losses in 2011 and 2008 resulting from
the poor performance of the equity markets. In 2012, we plan to make cash contributions of $800 million to $1 billion ($250 million was made in January
2012) to our plans to improve the funded status of the plans. These contributions principally consist of voluntary contributions to our U.S. plans. The timing
and amount of contributions may be impacted by a number of factors, including the funded status of the plans.
Long-Lived Assets (including Tangible and Definite-Lived Intangible Assets)—To conduct our global business operations and execute our business
strategy, we acquire tangible and intangible assets, including property, plant and equipment and definite-lived intangible assets. At December 31, 2011, the
net carrying amount of these long-lived assets totaled approximately $6.5 billion. The determination of useful lives (for depreciation/amortization purposes)
and whether or not these assets are impaired involves the use of accounting estimates and assumptions, changes in which could materially impact our financial
condition or operating performance if actual results differ from such estimates and assumptions. We periodically evaluate the recoverability of the carrying
amount of our long-lived assets whenever events or changes in circumstances indicate that the carrying amount of a long-lived asset group may not be fully
recoverable. The principal factors we consider in deciding when to perform an impairment review are as follows:
• significant under-performance (i.e., declines in sales, earnings or cash flows) of a business or product line in relation to expectations;
• annual operating plans or five-year strategic plans that indicate an unfavorable trend in operating performance of a business or product line;
• significant negative industry or economic trends; and
• significant changes or planned changes in our use of the assets.
Once it is determined that an impairment review is necessary, recoverability of assets is measured by comparing the carrying amount of the asset
grouping to the estimated future undiscounted cash flows. If the carrying amount exceeds the estimated future undiscounted cash flows, the asset grouping is
considered to be impaired. The impairment is then measured as the difference between the carrying amount of the asset grouping and its fair value. We
endeavor to utilize the best information available to measure fair value, which is usually either market prices (if available), level 1 or level 2 in the fair value
hierarchy or an estimate of the future discounted cash flow, level 3 of the fair value hierarchy. The key estimates in our discounted cash flow analysis include
expected industry growth rates, our assumptions as to volume, selling prices and costs, and the discount rate selected. As described in more detail in Note 16
to the financial statements, we have recorded impairment charges related to long-lived assets of $127 million and $30 million in 2011 and 2010, respectively,
principally related to manufacturing plant and equipment in facilities scheduled to close or be downsized.
52