Honeywell 2011 Annual Report Download - page 42
Download and view the complete annual report
Please find page 42 of the 2011 Honeywell annual report below. You can navigate through the pages in the report by either clicking on the pages listed below, or by using the keyword search tool below to find specific information within the annual report.-
 1
1 -
2
-
3
-
4
-
5
-
6
-
7
-
8
-
9
-
10
-
11
-
12
-
13
-
14
-
15
-
16
-
17
-
18
-
19
-
20
-
21
-
22
-
23
-
24
-
25
-
26
-
27
-
28
-
29
-
30
-
31
-
 32
32 -
 33
33 -
 34
34 -
 35
35 -
 36
36 -
 37
37 -
 38
38 -
 39
39 -
 40
40 -
 41
41 -
 42
42 -
 43
43 -
 44
44 -
 45
45 -
 46
46 -
 47
47 -
 48
48 -
 49
49 -
 50
50 -
 51
51 -
 52
52 -
53
-
54
-
55
-
56
-
57
-
58
-
59
-
60
-
61
-
62
-
63
-
64
-
65
-
66
-
67
-
68
-
69
-
70
-
71
-
72
-
73
-
74
-
75
-
76
-
77
-
78
-
79
-
80
-
81
-
82
-
83
-
84
-
85
-
86
-
87
-
88
-
89
-
90
-
91
-
92
-
93
-
94
-
95
-
96
-
97
-
98
-
99
-
100
-
101
-
102
-
103
-
104
-
105
-
106
-
107
-
108
-
109
-
110
-
111
-
112
-
113
-
114
-
115
-
116
-
117
-
118
-
119
-
120
-
121
-
122
-
123
-
124
-
125
-
126
-
127
-
128
-
129
-
130
-
131
-
132
-
133
-
134
-
135
-
136
-
137
-
138
-
139
-
140
-
141
-
142
-
143
-
144
-
145
-
146
-
147
-
148
-
149
-
150
-
151
-
152
-
153
-
154
-
155
-
156
-
157
-
158
-
159
 |
 |

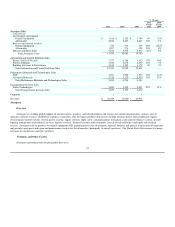
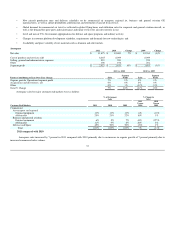
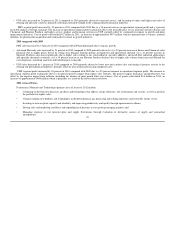
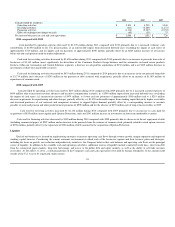
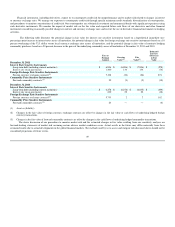
•UOP sales increased by 24 percent in 2011 compared to 2010 primarily driven by increased service, and licensing revenues and higher unit sales of
refining and specialty catalysts, primarily reflecting continued strength in the refining and petrochemical industries.
PMT segment profit increased by 39 percent in 2011 compared with 2010 due to a 38 percent increase in operational segment profit and a 1 percent
favorable impact of foreign exchange. The increase in operational segment profit is primarily due to the favorable price to raw materials spread in Resins and
Chemicals and Fluorine Products and higher service, product and licensing revenues in UOP, partially offset by continued investment in growth and plant
optimization initiatives. Cost of goods sold totaled $4.2 billion in 2011, an increase of approximately $597 million which is primarily due to volume, material
inflation, the phenol plant acquisition and continued investment in growth initiatives.
2010 compared with 2009
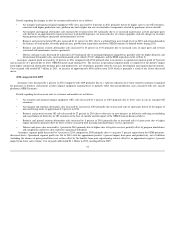
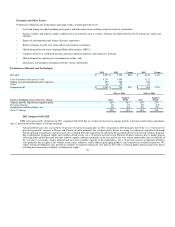
PMT sales increased by 14 percent in 2010 compared with 2009 predominantly due to organic growth.
•Advanced Materials sales increased by 23 percent in 2010 compared to 2009 primarily driven by (i) a 29 percent increase in Resins and Chemicals sales
primarily due to higher prices driven by strong Asia demand, formula pricing arrangements and agricultural demand, (ii) a 21 percent increase in
Specialty Products sales most significantly due to higher sales volume to our semiconductor, specialty additives, advanced fiber industrial applications
and specialty chemicals customers, (iii) a 19 percent increase in our Fluorine Products business due to higher sales volume from increased demand for
our refrigerants, insulating materials and industrial processing aids.
•UOP sales decreased by 1 percent in 2010 compared to 2009 primarily driven by lower new unit catalyst sales and timing of projects activity in the
refining and petrochemical industries, partially offset by increased gas processing equipment sales.
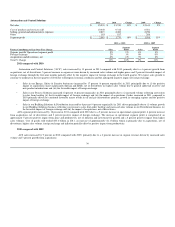
PMT segment profit increased by 24 percent in 2010 compared with 2009 due to a 25 percent increase in operational segment profit. The increase in
operational segment profit is primarily due to a 24 percent positive impact from higher sales volumes. The positive impact from price and productivity was
offset by the negative impact from inflation (including the absence of prior period labor cost actions). Cost of goods sold totaled $3.6 billion in 2010, an
increase of approximately $400 million which is primarily as a result of the factors discussed above.
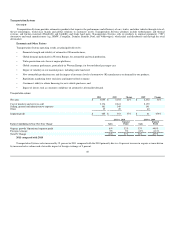
2012 Areas of Focus
Performance Materials and Technologies primary areas of focus for 2012 include:
•Continuing to develop new processes, products and technologies that address energy efficiency, the environment and security, as well as position
the portfolio for higher value;
• Commercializing new products and technologies in the petrochemical, gas processing and refining industries and renewable energy sector;
• Investing to increase plant capacity and reliability and improving productivity and quality through operational excellence;
• Driving sales and marketing excellence and expanding local presence in fast growing emerging markets; and
•Managing exposure to raw material price and supply fluctuations through evaluation of alternative sources of supply and contractual
arrangements. 39