Honeywell 2011 Annual Report Download - page 104
Download and view the complete annual report
Please find page 104 of the 2011 Honeywell annual report below. You can navigate through the pages in the report by either clicking on the pages listed below, or by using the keyword search tool below to find specific information within the annual report.-
 1
1 -
2
-
3
-
4
-
5
-
6
-
7
-
8
-
9
-
10
-
11
-
12
-
13
-
14
-
15
-
16
-
17
-
18
-
19
-
20
-
21
-
22
-
23
-
24
-
25
-
26
-
27
-
28
-
29
-
30
-
31
-
32
-
33
-
34
-
35
-
36
-
37
-
38
-
39
-
40
-
41
-
42
-
43
-
44
-
45
-
46
-
47
-
48
-
49
-
50
-
51
-
52
-
53
-
54
-
55
-
56
-
57
-
58
-
59
-
60
-
61
-
62
-
63
-
64
-
65
-
66
-
67
-
68
-
69
-
70
-
71
-
72
-
73
-
74
-
75
-
76
-
77
-
78
-
79
-
80
-
81
-
82
-
83
-
84
-
85
-
86
-
87
-
88
-
89
-
90
-
91
-
92
-
93
-
 94
94 -
 95
95 -
 96
96 -
 97
97 -
 98
98 -
 99
99 -
 100
100 -
 101
101 -
 102
102 -
 103
103 -
 104
104 -
 105
105 -
 106
106 -
 107
107 -
 108
108 -
 109
109 -
 110
110 -
 111
111 -
 112
112 -
 113
113 -
 114
114 -
115
-
116
-
117
-
118
-
119
-
120
-
121
-
122
-
123
-
124
-
125
-
126
-
127
-
128
-
129
-
130
-
131
-
132
-
133
-
134
-
135
-
136
-
137
-
138
-
139
-
140
-
141
-
142
-
143
-
144
-
145
-
146
-
147
-
148
-
149
-
150
-
151
-
152
-
153
-
154
-
155
-
156
-
157
-
158
-
159
 |
 |

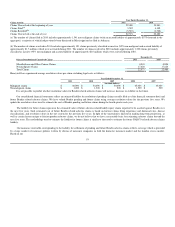
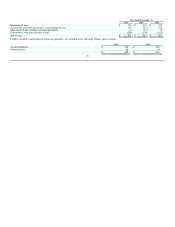
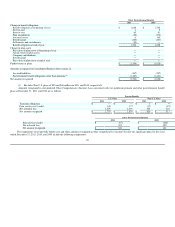
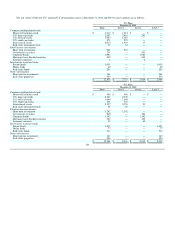
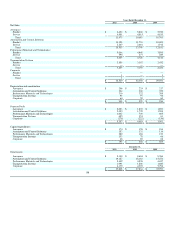
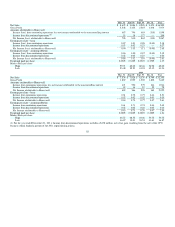
Other Postretirement Benefits
Years Ended December 31,
Net Periodic Benefit Cost 2011 2010 2009
Service cost $ 1 $ 2 $ 6
Interest cost 69 81 104
Amortization of prior service (credit) (34) (44) (44)
Recognition of actuarial losses 38 34 13
Settlements and curtailments (167) (47) (98)
Net periodic benefit (income) cost $ (93) $ 26 $ (19)
Other Changes in Plan Assets and Benefits Obligations
Recognized in Other Comprehensive (Income) Loss Years Ended December 31,
2011 2010 2009
Actuarial losses $ 6 $ 160 $ 46
Prior service (credit) (21) (176) (180)
Prior service credit recognized during year 34 44 44
Actuarial losses recognized during year (38) (34) (13)
Settlements and curtailments 167 47 98
Total recognized in other comprehensive loss (income) $ 148 $ 41 $ (5)
Total recognized in net periodic benefit cost and other comprehensive loss (income) $ 55 $ 67 $ (24)
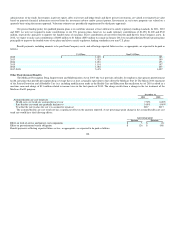
The estimated net loss and prior service (credit) for other postretirement benefits that will be amortized from accumulated other comprehensive
(income) loss into net periodic benefit cost in 2012 are expected to be $40 and $(15) million, respectively.
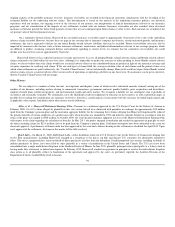
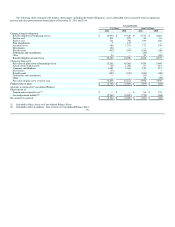
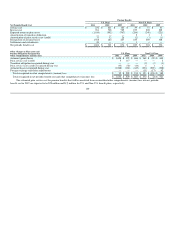
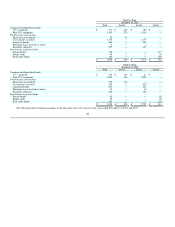
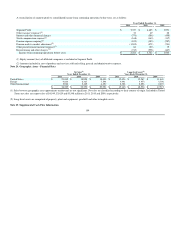
Major actuarial assumptions used in determining the benefit obligations and net periodic benefit cost for our significant benefit plans are presented in
the following table.
Pension Benefits
U.S. Plans Non-U.S. Plans
2011 2010 2009 2011 2010 2009
Actuarial assumptions used to determine benefit obligations as of December 31:
Discount rate 4.89% 5.25% 5.75% 4.84% 5.40% 5.71%
Expected annual rate of compensation increase 4.50% 4.50% 4.50% 3.67% 3.79% 3.87%
Actuarial assumptions used to determine net periodic benefit cost for years ended December 31:
Discount rate 5.25% 5.75% 6.95% 5.40% 5.71% 6.21%
Expected rate of return on plan assets 8.00% 9.00% 9.00% 7.06% 7.51% 7.52%
Expected annual rate of compensation increase 4.50% 4.50% 4.50% 3.79% 3.87% 3.33%
101