Honeywell 2011 Annual Report Download - page 80
Download and view the complete annual report
Please find page 80 of the 2011 Honeywell annual report below. You can navigate through the pages in the report by either clicking on the pages listed below, or by using the keyword search tool below to find specific information within the annual report.-
 1
1 -
2
-
3
-
4
-
5
-
6
-
7
-
8
-
9
-
10
-
11
-
12
-
13
-
14
-
15
-
16
-
17
-
18
-
19
-
20
-
21
-
22
-
23
-
24
-
25
-
26
-
27
-
28
-
29
-
30
-
31
-
32
-
33
-
34
-
35
-
36
-
37
-
38
-
39
-
40
-
41
-
42
-
43
-
44
-
45
-
46
-
47
-
48
-
49
-
50
-
51
-
52
-
53
-
54
-
55
-
56
-
57
-
58
-
59
-
60
-
61
-
62
-
63
-
64
-
65
-
66
-
67
-
68
-
69
-
 70
70 -
 71
71 -
 72
72 -
 73
73 -
 74
74 -
 75
75 -
 76
76 -
 77
77 -
 78
78 -
 79
79 -
 80
80 -
 81
81 -
 82
82 -
 83
83 -
 84
84 -
 85
85 -
 86
86 -
 87
87 -
 88
88 -
 89
89 -
 90
90 -
91
-
92
-
93
-
94
-
95
-
96
-
97
-
98
-
99
-
100
-
101
-
102
-
103
-
104
-
105
-
106
-
107
-
108
-
109
-
110
-
111
-
112
-
113
-
114
-
115
-
116
-
117
-
118
-
119
-
120
-
121
-
122
-
123
-
124
-
125
-
126
-
127
-
128
-
129
-
130
-
131
-
132
-
133
-
134
-
135
-
136
-
137
-
138
-
139
-
140
-
141
-
142
-
143
-
144
-
145
-
146
-
147
-
148
-
149
-
150
-
151
-
152
-
153
-
154
-
155
-
156
-
157
-
158
-
159
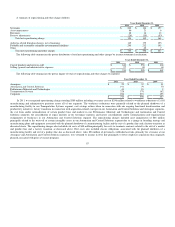
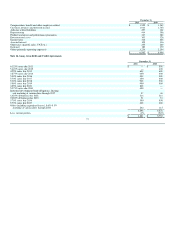
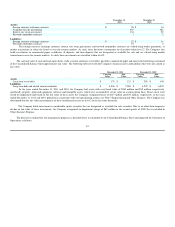
 |
 |

December 31,
2011 2010
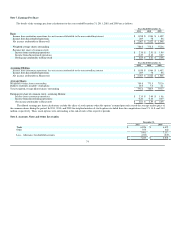
Compensation, benefit and other employee related $ 1,555 $ 1,363
Customer advances and deferred income 1,914 1,703
Asbestos related liabilities 237 162
Repositioning 414 306
Product warranties and performance guarantees 367 380
Environmental costs 303 328
Income taxes 318 466
Accrued interest 108 116
Other taxes (payroll, sales, VAT etc.) 233 249
Insurance 180 179
Other (primarily operating expenses) 1,234 1,194
$ 6,863 $ 6,446
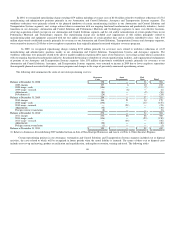
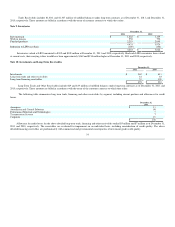
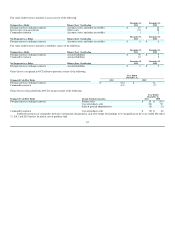
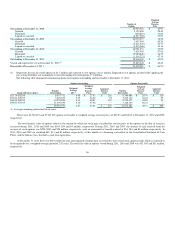
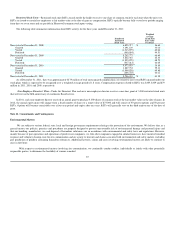
Note 14. Long -term Debt and Credit Agreements
December 31,
2011 2010
6.125% notes due 2011 $ — $ 500
5.625% notes due 2012 — 400
4.25% notes due 2013 600 600
3.875% notes due 2014 600 600
5.40% notes due 2016 400 400
5.30% notes due 2017 400 400
5.30% notes due 2018 900 900
5.00% notes due 2019 900 900
4.25% notes due 2021 800 —
5.375% notes due 2041 600 —
Industrial development bond obligations, floating
rate maturing at various dates through 2037 37 46
6.625% debentures due 2028 216 216
9.065% debentures due 2033 51 51
5.70% notes due 2036 550 550
5.70% notes due 2037 600 600
Other (including capitalized leases), 0.6%-9.5%
maturing at various dates through 2023 242 115
6,896 6,278
Less: current portion (15) (523)
$ 6,881 $ 5,755
77