Honeywell 2011 Annual Report Download - page 31
Download and view the complete annual report
Please find page 31 of the 2011 Honeywell annual report below. You can navigate through the pages in the report by either clicking on the pages listed below, or by using the keyword search tool below to find specific information within the annual report.-
 1
1 -
2
-
3
-
4
-
5
-
6
-
7
-
8
-
9
-
10
-
11
-
12
-
13
-
14
-
15
-
16
-
17
-
18
-
19
-
20
-
 21
21 -
 22
22 -
 23
23 -
 24
24 -
 25
25 -
 26
26 -
 27
27 -
 28
28 -
 29
29 -
 30
30 -
 31
31 -
 32
32 -
 33
33 -
 34
34 -
 35
35 -
 36
36 -
 37
37 -
 38
38 -
 39
39 -
 40
40 -
 41
41 -
42
-
43
-
44
-
45
-
46
-
47
-
48
-
49
-
50
-
51
-
52
-
53
-
54
-
55
-
56
-
57
-
58
-
59
-
60
-
61
-
62
-
63
-
64
-
65
-
66
-
67
-
68
-
69
-
70
-
71
-
72
-
73
-
74
-
75
-
76
-
77
-
78
-
79
-
80
-
81
-
82
-
83
-
84
-
85
-
86
-
87
-
88
-
89
-
90
-
91
-
92
-
93
-
94
-
95
-
96
-
97
-
98
-
99
-
100
-
101
-
102
-
103
-
104
-
105
-
106
-
107
-
108
-
109
-
110
-
111
-
112
-
113
-
114
-
115
-
116
-
117
-
118
-
119
-
120
-
121
-
122
-
123
-
124
-
125
-
126
-
127
-
128
-
129
-
130
-
131
-
132
-
133
-
134
-
135
-
136
-
137
-
138
-
139
-
140
-
141
-
142
-
143
-
144
-
145
-
146
-
147
-
148
-
149
-
150
-
151
-
152
-
153
-
154
-
155
-
156
-
157
-
158
-
159
 |
 |

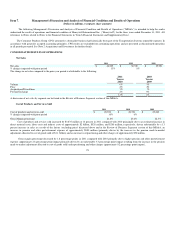
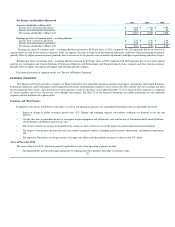
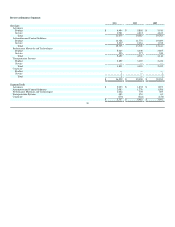
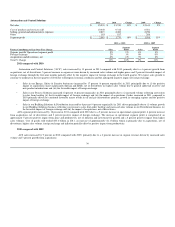
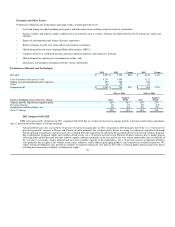
Net Income Attributable to Honeywell
2011 2010 2009
Amounts attributable to Honeywell
Income from continuing operations $ 1,858 $ 1,944 $ 1,492
Income from discontinued operations 209 78 56
Net income attributable to Honeywell $ 2,067 $ 2,022 $ 1,548
Earnings per share of common stock – assuming dilution
Income from continuing operations $ 2.35 $ 2.49 $ 1.98
Income from discontinued operations 0.26 0.10 0.07
Net income attributable to Honeywell $ 2.61 $ 2.59 $ 2.05
Earnings per share of common stock – assuming dilution increased by $0.02 per share in 2011 compared with 2010 primarily due to an increase in
segment profit in each of our business segments, lower tax expense, the gain on disposal of discontinued operations, and lower other postretirement expense,
partially offset by higher pension expense (primarily due to an increase in the pension mark-to-market adjustment) and higher repositioning and other charges.
Earnings per share of common stock – assuming dilution increased by $0.54 per share in 2010 compared with 2009 primarily due to increased segment
profit in our Automation and Control Solutions, Performance Materials and Technologies and Transportation Systems segments and lower pension expense,
partially offset by higher tax expense and higher repositioning and other charges.
For further discussion of segment results, see "Review of Business Segments".
BUSINESS OVERVIEW
This Business Overview provides a summary of Honeywell and its four reportable operating segments (Aerospace, Automation and Control Solutions,
Performance Materials and Technologies and Transportation Systems), including their respective areas of focus for 2012 and the relevant economic and other
factors impacting their results, and a discussion of each segment's results for the three years ended December 31, 2011. Each of these segments is comprised
of various product and service classes that serve multiple end markets. See Note 23 to the financial statements for further information on our reportable
segments and our definition of segment profit.
Economic and Other Factors
In addition to the factors listed below with respect to each of our operating segments, our consolidated operating results are principally driven by:
•Impact of change in global economic growth rates (U.S., Europe and emerging regions) and industry conditions on demand in our key end
markets;
• Overall sales mix, in particular the mix of Aerospace original equipment and aftermarket sales and the mix of Automation and Control Solutions
(ACS) products, distribution and services sales;
• The extent to which cost savings from productivity actions are able to offset or exceed the impact of material and non-material inflation;
•The impact of the pension discount rate and asset returns on pension expense, including mark-to-market adjustments, and funding requirements;
and
• The impact of fluctuations in foreign currency exchange rates (Euro and other global currencies), relative to the U.S. dollar.
Areas of Focus for 2012
The areas of focus for 2012, which are generally applicable to each of our operating segments, include:
• Driving profitable growth and margin expansion by building innovative products that address customer needs;
28