Honeywell 2011 Annual Report Download - page 101
Download and view the complete annual report
Please find page 101 of the 2011 Honeywell annual report below. You can navigate through the pages in the report by either clicking on the pages listed below, or by using the keyword search tool below to find specific information within the annual report.-
 1
1 -
2
-
3
-
4
-
5
-
6
-
7
-
8
-
9
-
10
-
11
-
12
-
13
-
14
-
15
-
16
-
17
-
18
-
19
-
20
-
21
-
22
-
23
-
24
-
25
-
26
-
27
-
28
-
29
-
30
-
31
-
32
-
33
-
34
-
35
-
36
-
37
-
38
-
39
-
40
-
41
-
42
-
43
-
44
-
45
-
46
-
47
-
48
-
49
-
50
-
51
-
52
-
53
-
54
-
55
-
56
-
57
-
58
-
59
-
60
-
61
-
62
-
63
-
64
-
65
-
66
-
67
-
68
-
69
-
70
-
71
-
72
-
73
-
74
-
75
-
76
-
77
-
78
-
79
-
80
-
81
-
82
-
83
-
84
-
85
-
86
-
87
-
88
-
89
-
90
-
 91
91 -
 92
92 -
 93
93 -
 94
94 -
 95
95 -
 96
96 -
 97
97 -
 98
98 -
 99
99 -
 100
100 -
 101
101 -
 102
102 -
 103
103 -
 104
104 -
 105
105 -
 106
106 -
 107
107 -
 108
108 -
 109
109 -
 110
110 -
 111
111 -
112
-
113
-
114
-
115
-
116
-
117
-
118
-
119
-
120
-
121
-
122
-
123
-
124
-
125
-
126
-
127
-
128
-
129
-
130
-
131
-
132
-
133
-
134
-
135
-
136
-
137
-
138
-
139
-
140
-
141
-
142
-
143
-
144
-
145
-
146
-
147
-
148
-
149
-
150
-
151
-
152
-
153
-
154
-
155
-
156
-
157
-
158
-
159
 |
 |

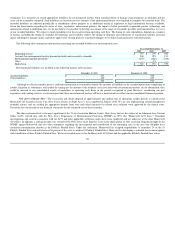
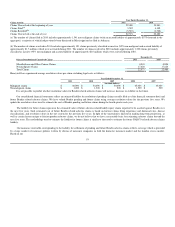
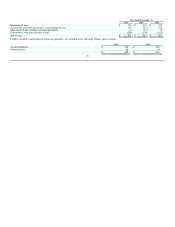
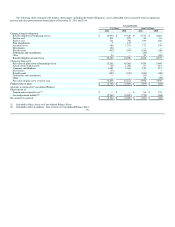
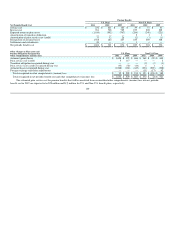
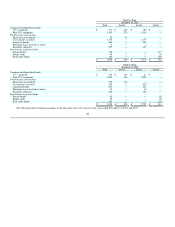
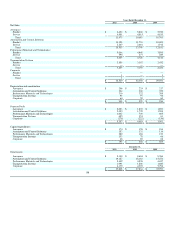
The following tables summarize the balance sheet impact, including the benefit obligations, assets and funded status associated with our significant
pension and other postretirement benefit plans at December 31, 2011 and 2010.
Pension Benefits
U.S. Plans Non-U.S. Plans
2011 2010 2011 2010
Change in benefit obligation:
Benefit obligation at beginning of year $ 14,990 $ 13,620 $ 4,373 $ 4,266
Service cost 232 221 59 51
Interest cost 761 768 239 228
Plan amendments 5 117 — —
Actuarial losses 566 1,211 171 150
Divestitures (26) — — —
Benefits paid (952) (947) (189) (181)
Settlements and curtailments — — (25) —
Other 24 — 20 (141)
Benefit obligation at end of year 15,600 14,990 4,648 4,373
Change in plan assets:
Fair value of plan assets at beginning of year 12,181 10,306 3,939 3,488
Actual return on plan assets (41) 1,788 87 414
Company contributions 1,681 1,034 124 313
Divestitures (33) — — —
Benefits paid (952) (947) (189) (181)
Settlements and curtailments — — (25) —
Other — — 22 (95)
Fair value of plan assets at end of year 12,836 12,181 3,958 3,939
Funded status of plans $ (2,764) $ (2,809) $ (690) $ (434)
Amounts recognized in Consolidated Balance
Sheet consist of:
Prepaid pension benefit cost(1) $ — $ — $ 84 $ 135
Accrued pension liability(2) (2,764) (2,809) (774) (569)
Net amount recognized $ (2,764) $ (2,809) $ (690) $ (434)
(1) Included in Other Assets on Consolidated Balance Sheet
(2) Included in Other Liabilities - Non-Current on Consolidated Balance Sheet
98