Honeywell 2011 Annual Report Download - page 61
Download and view the complete annual report
Please find page 61 of the 2011 Honeywell annual report below. You can navigate through the pages in the report by either clicking on the pages listed below, or by using the keyword search tool below to find specific information within the annual report.-
 1
1 -
2
-
3
-
4
-
5
-
6
-
7
-
8
-
9
-
10
-
11
-
12
-
13
-
14
-
15
-
16
-
17
-
18
-
19
-
20
-
21
-
22
-
23
-
24
-
25
-
26
-
27
-
28
-
29
-
30
-
31
-
32
-
33
-
34
-
35
-
36
-
37
-
38
-
39
-
40
-
41
-
42
-
43
-
44
-
45
-
46
-
47
-
48
-
49
-
50
-
 51
51 -
 52
52 -
 53
53 -
 54
54 -
 55
55 -
 56
56 -
 57
57 -
 58
58 -
 59
59 -
 60
60 -
 61
61 -
 62
62 -
 63
63 -
 64
64 -
 65
65 -
 66
66 -
 67
67 -
 68
68 -
 69
69 -
 70
70 -
 71
71 -
72
-
73
-
74
-
75
-
76
-
77
-
78
-
79
-
80
-
81
-
82
-
83
-
84
-
85
-
86
-
87
-
88
-
89
-
90
-
91
-
92
-
93
-
94
-
95
-
96
-
97
-
98
-
99
-
100
-
101
-
102
-
103
-
104
-
105
-
106
-
107
-
108
-
109
-
110
-
111
-
112
-
113
-
114
-
115
-
116
-
117
-
118
-
119
-
120
-
121
-
122
-
123
-
124
-
125
-
126
-
127
-
128
-
129
-
130
-
131
-
132
-
133
-
134
-
135
-
136
-
137
-
138
-
139
-
140
-
141
-
142
-
143
-
144
-
145
-
146
-
147
-
148
-
149
-
150
-
151
-
152
-
153
-
154
-
155
-
156
-
157
-
158
-
159
 |
 |

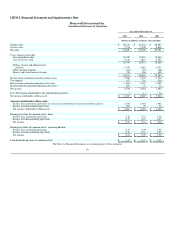
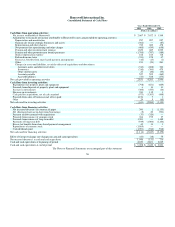
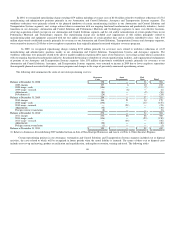
Honeywell International Inc.
Consolidated Statement of Cash Flows
Years Ended December 31,
2011 2010 2009
(Dollars in millions)
Cash flows from operating activities:
Net income attributable to Honeywell $ 2,067 $ 2,022 $ 1,548
Adjustments to reconcile net income attributable to Honeywell to net cash provided by operating activities:
Depreciation and amortization 957 987 957
Gain on sale of non-strategic businesses and assets (362) — (87)
Repositioning and other charges 743 600 478
Net payments for repositioning and other charges (468) (439) (658)
Pension and other postretirement expense 1,823 689 1,022
Pension and other postretirement benefit payments (1,788) (787) (189)
Stock compensation expense 168 164 118
Deferred income taxes (331) 878 47
Excess tax benefits from share based payment arrangements (42) (13) (1)
Other 194 (24) 261
Changes in assets and liabilities, net of the effects of acquisitions and divestitures:
Accounts, notes and other receivables (316) (688) 360
Inventories (310) (300) 475
Other current assets 25 (26) (43)
Accounts payable 527 592 (169)
Accrued liabilities (54) 548 (173)
Net cash provided by operating activities 2,833 4,203 3,946
Cash flows from investing activities:
Expenditures for property, plant and equipment (798) (651) (609)
Proceeds from disposals of property, plant and equipment 6 14 31
Increase in investments (380) (453) (24)
Decrease in investments 354 112 1
Cash paid for acquisitions, net of cash acquired (973) (1,303) (468)
Proceeds from sales of businesses,net of fees paid 1,156 7 1
Other 24 5 (65)
Net cash used for investing activities (611) (2,269) (1,133)
Cash flows from financing activities:
Net increase/(decrease) in commercial paper 300 1 (1,133)
Net (decrease)/increase in short-term borrowings (2) 20 (521)
Payment of debt assumed with acquisitions (33) (326) —
Proceeds from issuance of common stock 304 195 37
Proceeds from issuance of long-term debt 1,390 — 1,488
Payments of long-term debt (939) (1,006) (1,106)
Excess tax benefits from share based payment arrangements 42 13 1
Repurchases of common stock (1,085) — —
Cash dividends paid (1,091) (944) (918)
Net cash used for financing activities (1,114) (2,047) (2,152)
Effect of foreign exchange rate changes on cash and cash equivalents (60) (38) 75
Net increase/(decrease) in cash and cash equivalents 1,048 (151) 736
Cash and cash equivalents at beginning of period 2,650 2,801 2,065
Cash and cash equivalents at end of period $ 3,698 $ 2,650 $ 2,801
The Notes to Financial Statements are an integral part of this statement.
58