Honeywell 2011 Annual Report Download - page 75
Download and view the complete annual report
Please find page 75 of the 2011 Honeywell annual report below. You can navigate through the pages in the report by either clicking on the pages listed below, or by using the keyword search tool below to find specific information within the annual report.-
 1
1 -
2
-
3
-
4
-
5
-
6
-
7
-
8
-
9
-
10
-
11
-
12
-
13
-
14
-
15
-
16
-
17
-
18
-
19
-
20
-
21
-
22
-
23
-
24
-
25
-
26
-
27
-
28
-
29
-
30
-
31
-
32
-
33
-
34
-
35
-
36
-
37
-
38
-
39
-
40
-
41
-
42
-
43
-
44
-
45
-
46
-
47
-
48
-
49
-
50
-
51
-
52
-
53
-
54
-
55
-
56
-
57
-
58
-
59
-
60
-
61
-
62
-
63
-
64
-
 65
65 -
 66
66 -
 67
67 -
 68
68 -
 69
69 -
 70
70 -
 71
71 -
 72
72 -
 73
73 -
 74
74 -
 75
75 -
 76
76 -
 77
77 -
 78
78 -
 79
79 -
 80
80 -
 81
81 -
 82
82 -
 83
83 -
 84
84 -
 85
85 -
86
-
87
-
88
-
89
-
90
-
91
-
92
-
93
-
94
-
95
-
96
-
97
-
98
-
99
-
100
-
101
-
102
-
103
-
104
-
105
-
106
-
107
-
108
-
109
-
110
-
111
-
112
-
113
-
114
-
115
-
116
-
117
-
118
-
119
-
120
-
121
-
122
-
123
-
124
-
125
-
126
-
127
-
128
-
129
-
130
-
131
-
132
-
133
-
134
-
135
-
136
-
137
-
138
-
139
-
140
-
141
-
142
-
143
-
144
-
145
-
146
-
147
-
148
-
149
-
150
-
151
-
152
-
153
-
154
-
155
-
156
-
157
-
158
-
159
 |
 |

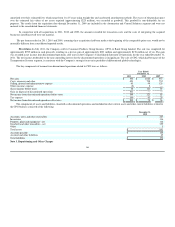
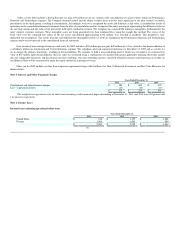
The effective tax rate increased by 5.9 percentage points in 2010 compared to 2009 primarily due to a change in the mix of earnings related to lower
U.S. pension expense, the impact of an enacted change in the tax treatment of the Medicare Part D program, the absence of manufacturing incentives, a
decreased impact from the settlement of audits and an increase in the foreign effective tax rate. The foreign effective tax rate increased by approximately 7
percentage points which primarily consisted of i) a 6 percentage point impact from the absence of tax benefits related to foreign exchange and investment
losses and ii) a (0.1) percentage point impact from increased valuation allowances on net operating losses.
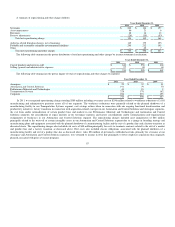
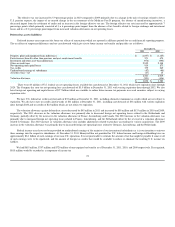
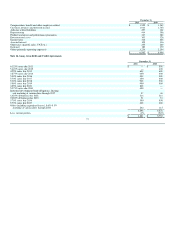
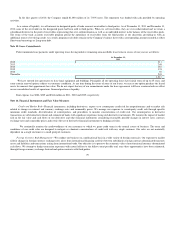
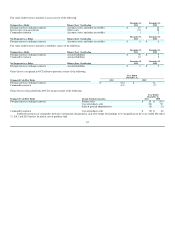
Deferred tax assets (liabilities)
Deferred income taxes represent the future tax effects of transactions which are reported in different periods for tax and financial reporting purposes.
The tax effects of temporary differences and tax carryforwards which give rise to future income tax benefits and payables are as follows:
December 31,
2011 2010
Property, plant and equipment basis differences $ (1,097) $ (1,107)
Postretirement benefits other than pensions and post employment benefits 571 674
Investment and other asset basis differences (970) (993)
Other accrued items 2,852 2,348
Net operating and capital losses 810 873
Tax credits 379 249
Undistributed earnings of subsidiaries (57) (40)
All other items—net (67) 15
2,421 2,019
Valuation allowance (591) (636)
$ 1,830 $ 1,383
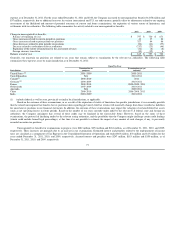
There were $3 million of U.S. federal tax net operating losses available for carryforward at December 31, 2011 which have expiration dates through
2029. The Company has state tax net operating loss carryforwards of $3.5 billion at December 31, 2011 with varying expiration dates through 2032. We also
have foreign net operating and capital losses of $2.7 billion which are available to reduce future income tax payments in several countries, subject to varying
expiration rules.
We have U.S. federal tax credit carryforwards of $35 million at December 31, 2011, including alternative minimum tax credits which are not subject to
expiration. We also have state tax credit carryforwards of $61 million at December 31, 2011, including carryforwards of $38 million with various expiration
dates through 2026 and tax credits of $23 million which are not subject to expiration.
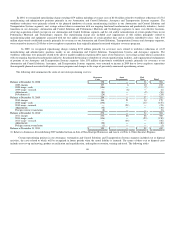
The valuation allowance against deferred tax assets decreased by $45 million in 2011 and increased by $58 million and $133 million in 2010 and 2009,
respectively. The 2011 decrease in the valuation allowance was primarily due to decreased foreign net operating losses related to the Netherlands and
Germany, partially offset by the increase in the valuation allowance of France, Luxembourg and Canada. The 2010 increase in the valuation allowance was
primarily due to increased foreign net operating losses related to France, Luxembourg, and the Netherlands offset by the reversal of a valuation allowance
related to Germany. The 2010 increase in valuation allowance also includes adjustments related to purchase accounting for various acquisitions. The 2009
increase in the valuation allowance was primarily due to increased foreign net operating losses related to Germany, Luxembourg, and the Netherlands.
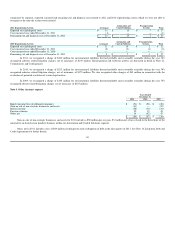
Federal income taxes have not been provided on undistributed earnings of the majority of our international subsidiaries as it is our intention to reinvest
these earnings into the respective subsidiaries. At December 31, 2011 Honeywell has not provided for U.S. federal income and foreign withholding taxes on
approximately $8.1 billion of such earnings of our non-U.S. operations. It is not practicable to estimate the amount of tax that might be payable if some or all
of such earnings were to be repatriated, and the amount of foreign tax credits that would be available to reduce or eliminate the resulting U.S. income tax
liability.
We had $815 million, $757 million and $720 million of unrecognized tax benefits as of December 31, 2011, 2010, and 2009 respectively. If recognized,
$815 million would be recorded as a component of income tax
72