Honeywell 2011 Annual Report Download - page 106
Download and view the complete annual report
Please find page 106 of the 2011 Honeywell annual report below. You can navigate through the pages in the report by either clicking on the pages listed below, or by using the keyword search tool below to find specific information within the annual report.-
 1
1 -
2
-
3
-
4
-
5
-
6
-
7
-
8
-
9
-
10
-
11
-
12
-
13
-
14
-
15
-
16
-
17
-
18
-
19
-
20
-
21
-
22
-
23
-
24
-
25
-
26
-
27
-
28
-
29
-
30
-
31
-
32
-
33
-
34
-
35
-
36
-
37
-
38
-
39
-
40
-
41
-
42
-
43
-
44
-
45
-
46
-
47
-
48
-
49
-
50
-
51
-
52
-
53
-
54
-
55
-
56
-
57
-
58
-
59
-
60
-
61
-
62
-
63
-
64
-
65
-
66
-
67
-
68
-
69
-
70
-
71
-
72
-
73
-
74
-
75
-
76
-
77
-
78
-
79
-
80
-
81
-
82
-
83
-
84
-
85
-
86
-
87
-
88
-
89
-
90
-
91
-
92
-
93
-
94
-
95
-
 96
96 -
 97
97 -
 98
98 -
 99
99 -
 100
100 -
 101
101 -
 102
102 -
 103
103 -
 104
104 -
 105
105 -
 106
106 -
 107
107 -
 108
108 -
 109
109 -
 110
110 -
 111
111 -
 112
112 -
 113
113 -
 114
114 -
 115
115 -
 116
116 -
117
-
118
-
119
-
120
-
121
-
122
-
123
-
124
-
125
-
126
-
127
-
128
-
129
-
130
-
131
-
132
-
133
-
134
-
135
-
136
-
137
-
138
-
139
-
140
-
141
-
142
-
143
-
144
-
145
-
146
-
147
-
148
-
149
-
150
-
151
-
152
-
153
-
154
-
155
-
156
-
157
-
158
-
159
 |
 |

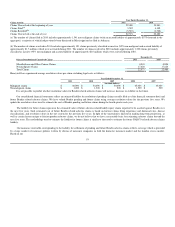
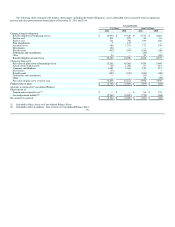
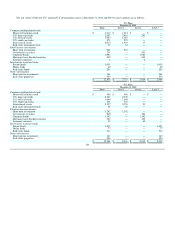
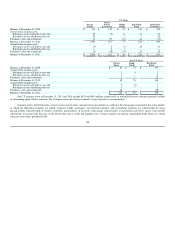
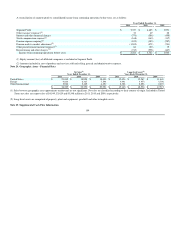
The fair values of both our U.S. and non-U.S. pension plans assets at December 31, 2011 and 2010 by asset category are as follows:
U.S. Plans
December 31, 2011
Total Level 1 Level 2 Level 3
Common stock/preferred stock:
Honeywell common stock $ 1,012 $ 1,012 $ — $ —
U.S. large cap stocks 2,697 2,416 281 —
U.S. mid cap stocks 1,087 1,087 — —
U.S. small cap stocks 272 272 — —
International stocks 2,010 1,993 17 —
Real estate investment trusts 32 32 — —
Fixed income investments:
Short term investments 941 941 — —
Government securities 291 — 291 —
Corporate bonds 1,984 — 1,984 —
Mortgage/Asset-Backed securities 435 — 435 —
Insurance contracts 6 — 6 —
Investments in private funds:
Private funds 1,039 — — 1,039
Hedge funds 60 — — 60
Real estate funds 256 — — 256
Direct investments:
Direct private investments 161 — — 161
Real estate properties 553 — — 553
$ 12,836 $ 7,753 $ 3,014 $ 2,069
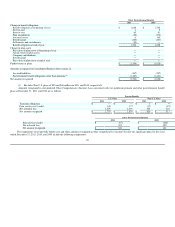
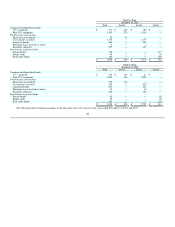
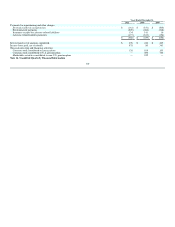
U.S. Plans
December 31, 2010
Total Level 1 Level 2 Level 3
Common stock/preferred stock:
Honeywell common stock $ 986 $ 986 $ — $ —
U.S. large cap stocks 2,349 2,349 — —
U.S. mid cap stocks 1,049 1,049 — —
U.S. small cap stocks 301 301 — —
International stocks 2,197 2,176 21 —
Real estate investment trusts 38 38 — —
Fixed income investments:
Short term investments 1,242 1,242 — —
Government securities 240 — 240 —
Corporate bonds 1,342 — 1,342 —
Mortgage/Asset-Backed securities 422 — 422 —
Insurance contracts 10 — 10 —
Investments in private funds:
Private funds 1,053 — — 1,053
Hedge funds 77 — — 77
Real estate funds 214 — — 214
Direct investments:
Direct private investments 167 — — 167
Real estate properties 494 — — 494
$ 12,181 $ 8,141 $ 2,035 $ 2,005
103