Honeywell 2011 Annual Report Download - page 45
Download and view the complete annual report
Please find page 45 of the 2011 Honeywell annual report below. You can navigate through the pages in the report by either clicking on the pages listed below, or by using the keyword search tool below to find specific information within the annual report.-
 1
1 -
2
-
3
-
4
-
5
-
6
-
7
-
8
-
9
-
10
-
11
-
12
-
13
-
14
-
15
-
16
-
17
-
18
-
19
-
20
-
21
-
22
-
23
-
24
-
25
-
26
-
27
-
28
-
29
-
30
-
31
-
32
-
33
-
34
-
 35
35 -
 36
36 -
 37
37 -
 38
38 -
 39
39 -
 40
40 -
 41
41 -
 42
42 -
 43
43 -
 44
44 -
 45
45 -
 46
46 -
 47
47 -
 48
48 -
 49
49 -
 50
50 -
 51
51 -
 52
52 -
 53
53 -
 54
54 -
 55
55 -
56
-
57
-
58
-
59
-
60
-
61
-
62
-
63
-
64
-
65
-
66
-
67
-
68
-
69
-
70
-
71
-
72
-
73
-
74
-
75
-
76
-
77
-
78
-
79
-
80
-
81
-
82
-
83
-
84
-
85
-
86
-
87
-
88
-
89
-
90
-
91
-
92
-
93
-
94
-
95
-
96
-
97
-
98
-
99
-
100
-
101
-
102
-
103
-
104
-
105
-
106
-
107
-
108
-
109
-
110
-
111
-
112
-
113
-
114
-
115
-
116
-
117
-
118
-
119
-
120
-
121
-
122
-
123
-
124
-
125
-
126
-
127
-
128
-
129
-
130
-
131
-
132
-
133
-
134
-
135
-
136
-
137
-
138
-
139
-
140
-
141
-
142
-
143
-
144
-
145
-
146
-
147
-
148
-
149
-
150
-
151
-
152
-
153
-
154
-
155
-
156
-
157
-
158
-
159
 |
 |

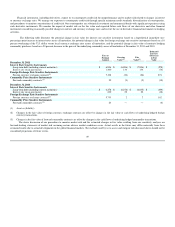
Years Ended December 31,
2011 2010 2009
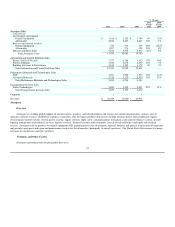
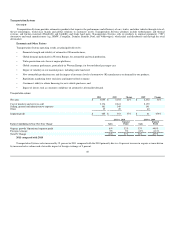
Aerospace
Net repositioning charge $ 29 $ 32 $ 31
Years Ended December 31,
2011 2010 2009
Automation and Control Solutions
Net repositioning charge $ 191 $ 79 $ 70
Years Ended December 31,
2011 2010 2009
Performance Materials and Technologies
Net repositioning charge $ 41 $ 18 $ 9
Years Ended December 31,
2011 2010 2009
Transportation Systems
Net repositioning charge $ 82 $ 20 $ 50
Asbestos related litigation charges, net of insurance 146 158 112
$ 228 $ 178 $ 162
Years Ended December 31,
2011 2010 2009
Corporate
Net repositioning charge $ 11 $ — $ —
Asbestos related litigation charges, net of insurance 3 17 43
Probable and reasonably estimable environmental liabilities 240 212 145
Other — 62 7
$ 254 $ 291 $ 195
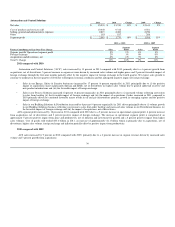
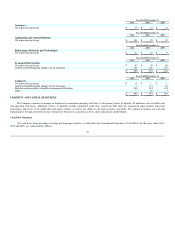
LIQUIDITY AND CAPITAL RESOURCES
The Company continues to manage its businesses to maximize operating cash flows as the primary source of liquidity. In addition to our available cash
and operating cash flows, additional sources of liquidity include committed credit lines, short-term debt from the commercial paper market, long-term
borrowings, and access to the public debt and equity markets, as well as the ability to sell trade accounts receivables. We continue to balance our cash and
financing uses through investment in our existing core businesses, acquisition activity, share repurchases and dividends.
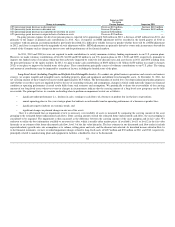
Cash Flow Summary
Our cash flows from operating, investing and financing activities, as reflected in the Consolidated Statement of Cash Flows for the years ended 2011,
2010 and 2009, are summarized as follows:
42