Honeywell 2011 Annual Report Download - page 109
Download and view the complete annual report
Please find page 109 of the 2011 Honeywell annual report below. You can navigate through the pages in the report by either clicking on the pages listed below, or by using the keyword search tool below to find specific information within the annual report.-
 1
1 -
2
-
3
-
4
-
5
-
6
-
7
-
8
-
9
-
10
-
11
-
12
-
13
-
14
-
15
-
16
-
17
-
18
-
19
-
20
-
21
-
22
-
23
-
24
-
25
-
26
-
27
-
28
-
29
-
30
-
31
-
32
-
33
-
34
-
35
-
36
-
37
-
38
-
39
-
40
-
41
-
42
-
43
-
44
-
45
-
46
-
47
-
48
-
49
-
50
-
51
-
52
-
53
-
54
-
55
-
56
-
57
-
58
-
59
-
60
-
61
-
62
-
63
-
64
-
65
-
66
-
67
-
68
-
69
-
70
-
71
-
72
-
73
-
74
-
75
-
76
-
77
-
78
-
79
-
80
-
81
-
82
-
83
-
84
-
85
-
86
-
87
-
88
-
89
-
90
-
91
-
92
-
93
-
94
-
95
-
96
-
97
-
98
-
 99
99 -
 100
100 -
 101
101 -
 102
102 -
 103
103 -
 104
104 -
 105
105 -
 106
106 -
 107
107 -
 108
108 -
 109
109 -
 110
110 -
 111
111 -
 112
112 -
 113
113 -
 114
114 -
 115
115 -
 116
116 -
 117
117 -
 118
118 -
 119
119 -
120
-
121
-
122
-
123
-
124
-
125
-
126
-
127
-
128
-
129
-
130
-
131
-
132
-
133
-
134
-
135
-
136
-
137
-
138
-
139
-
140
-
141
-
142
-
143
-
144
-
145
-
146
-
147
-
148
-
149
-
150
-
151
-
152
-
153
-
154
-
155
-
156
-
157
-
158
-
159
 |
 |

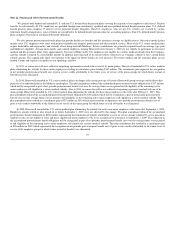
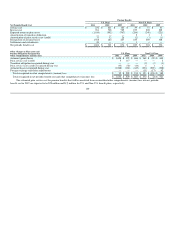
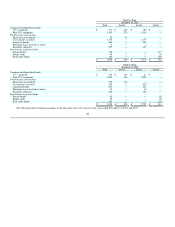
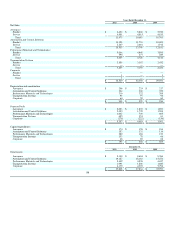
administrators of the funds. Investments in private equity, debt, real estate and hedge funds and direct private investments are valued at estimated fair value
based on quarterly financial information received from the investment advisor and/or general partner. Investments in real estate properties are valued on a
quarterly basis using the income approach. Valuation estimates are periodically supplemented by third party appraisals.
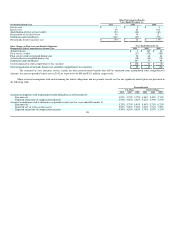
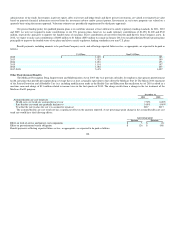
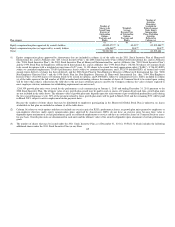
Our general funding policy for qualified pension plans is to contribute amounts at least sufficient to satisfy regulatory funding standards. In 2011, 2010
and 2009, we were not required to make contributions to our U.S. pension plans, however, we made voluntary contributions of $1,650, $1,000 and $740
million, respectively, primarily to improve the funded status of our plans. These contributions do not reflect benefits paid directly from Company assets. In
2012, we expect to make cash contributions of $800 million to $1 billion ($250 million was made in January 2012) to our global defined benefit pension plans
principally to improve the funded status of our plans and also to satisfy regulatory funding standards in our non-U.S. plans.
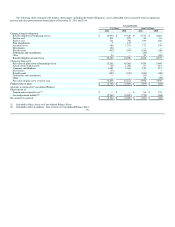
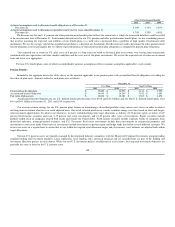
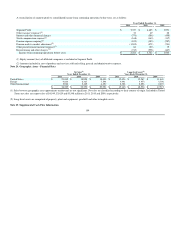
Benefit payments, including amounts to be paid from Company assets, and reflecting expected future service, as appropriate, are expected to be paid as
follows:
U.S. Plans Non-U.S. Plans
2012 $ 1,025 $ 185
2013 1,025 189
2014 1,051 193
2015 1,101 197
2016 1,084 203
2017-2021 5,473 1,097
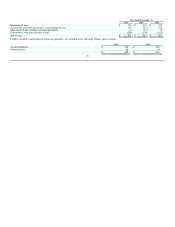
Other Postretirement Benefits
The Medicare Prescription Drug, Improvement and Modernization Act of 2003 (the Act) provides subsidies for employers that sponsor postretirement
health care plans that provide prescription drug coverage that is at least actuarially equivalent to that offered by Medicare Part D. The March 2010 enactment
of the Patient Protection and Affordable Care Act, including modifications made in the Health Care and Education Reconciliation Act of 2010 resulted in a
one-time, non-cash charge of $13 million related to income taxes in the first quarter of 2010. The charge results from a change in the tax treatment of the
Medicare Part D program.
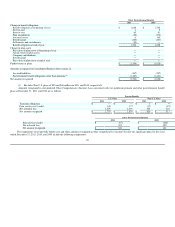
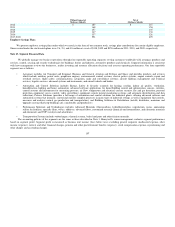
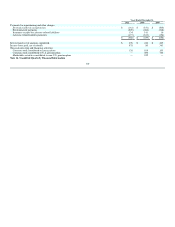
December 31,
2011 2010
Assumed health care cost trend rate:
Health care cost trend rate assumed for next year 7.50% 8.00%
Rate that the cost trend rate gradually declines to 5.00% 5.00%
Year that the rate reaches the rate it is assumed to remain at 2017 2017
The assumed health care cost trend rate has a significant effect on the amounts reported. A one-percentage-point change in the assumed health care cost
trend rate would have the following effects:
1 percentage point
Increase Decrease
Effect on total of service and interest cost components $ 5 $ (3)
Effect on postretirement benefit obligation $ 126 $ (80)
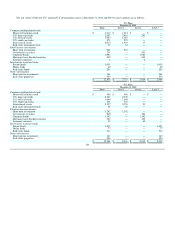
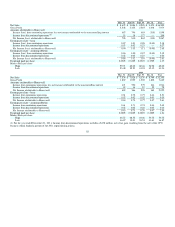
Benefit payments reflecting expected future service, as appropriate, are expected to be paid as follows:
106