Honeywell 2011 Annual Report Download - page 40
Download and view the complete annual report
Please find page 40 of the 2011 Honeywell annual report below. You can navigate through the pages in the report by either clicking on the pages listed below, or by using the keyword search tool below to find specific information within the annual report.-
 1
1 -
2
-
3
-
4
-
5
-
6
-
7
-
8
-
9
-
10
-
11
-
12
-
13
-
14
-
15
-
16
-
17
-
18
-
19
-
20
-
21
-
22
-
23
-
24
-
25
-
26
-
27
-
28
-
29
-
 30
30 -
 31
31 -
 32
32 -
 33
33 -
 34
34 -
 35
35 -
 36
36 -
 37
37 -
 38
38 -
 39
39 -
 40
40 -
 41
41 -
 42
42 -
 43
43 -
 44
44 -
 45
45 -
 46
46 -
 47
47 -
 48
48 -
 49
49 -
 50
50 -
51
-
52
-
53
-
54
-
55
-
56
-
57
-
58
-
59
-
60
-
61
-
62
-
63
-
64
-
65
-
66
-
67
-
68
-
69
-
70
-
71
-
72
-
73
-
74
-
75
-
76
-
77
-
78
-
79
-
80
-
81
-
82
-
83
-
84
-
85
-
86
-
87
-
88
-
89
-
90
-
91
-
92
-
93
-
94
-
95
-
96
-
97
-
98
-
99
-
100
-
101
-
102
-
103
-
104
-
105
-
106
-
107
-
108
-
109
-
110
-
111
-
112
-
113
-
114
-
115
-
116
-
117
-
118
-
119
-
120
-
121
-
122
-
123
-
124
-
125
-
126
-
127
-
128
-
129
-
130
-
131
-
132
-
133
-
134
-
135
-
136
-
137
-
138
-
139
-
140
-
141
-
142
-
143
-
144
-
145
-
146
-
147
-
148
-
149
-
150
-
151
-
152
-
153
-
154
-
155
-
156
-
157
-
158
-
159
 |
 |

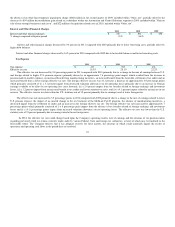
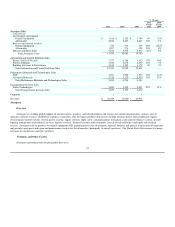
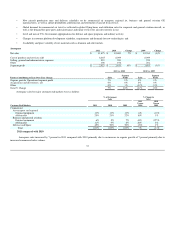
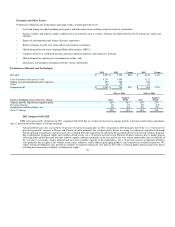
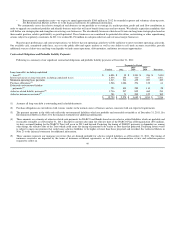
•Sales in our Energy, Safety & Security businesses increased by 14 percent in 2010 primarily reflecting higher sales volumes in our businesses
tied to industrial production (environmental and combustion controls, sensing and control, gas detection, personal protective equipment and
scanning and mobility products), new product introductions and acquisitions, primarily Sperian.
•Sales in Process Solutions increased 7 percent in 2010 primarily due to the positive impact of increased volume, acquisitions (primarily the RMG
Group), higher prices and industrial field solutions driven by order growth and conversion to sales from order backlog.
•Sales in Building Solutions & Distribution increased by 3 percent in 2010 driven primarily by energy efficiency projects and conversion to sales
from order backlog.
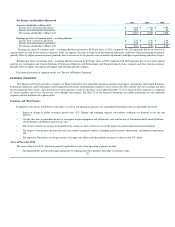
ACS segment profit increased by 11 percent in 2010 compared with 2009 due to a 9 percent increase in operational segment profit and 2 percent
increase from acquisitions. The increase in operational segment profit is comprised of an approximate 18 percent positive impact from higher sales volume,
partially offset by an approximate 9 percent negative impact from inflation, net of price and productivity (including the absence of prior period labor cost
actions, partially offset by the benefits of prior repositioning). Cost of goods sold totaled $9.3 billion in 2010, an increase of approximately $750 million
which is primarily as a result of the factors discussed above.
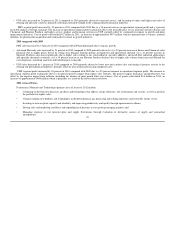
2012 Areas of Focus
ACS's primary areas of focus for 2012 include:
• Products and solutions for energy efficiency and asset management;
• Extending technology leadership: lowest total installed cost and integrated product solutions;
• Defending and extending our installed base through customer productivity and globalization;
• Sustaining strong brand recognition through our brand and channel management;
• Continued centralization and standardization of global software development capabilities;
• Continuing to identify, execute and integrate acquisitions in or adjacent to the markets which we serve;
• Continuing to establish and grow emerging markets presence and capability;
• Continuing to invest in new product development and introductions;
• Continued deployment and optimization of our common ERP system; and
• Increased focus on commercial and R&D effectiveness.
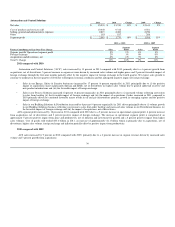
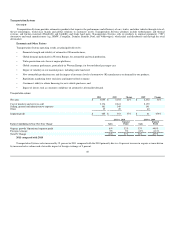
Performance Materials and Technologies (PMT)
Overview
During the fourth quarter of 2011, the Specialty Materials segment was renamed to Performance Materials and Technologies (PMT'). PMT better
reflects the businesses' expanded set of technology and product offerings that reach far beyond the traditional scope associated with specialty materials.
Performance Materials and Technologies develops and manufactures high-purity, high-quality and high-performance chemicals and materials for
applications in the refining, petrochemical, automotive, healthcare, agricultural, packaging, refrigeration, appliance, housing, semiconductor, wax and
adhesives segments. Performance Materials and Technologies also provides process technology, products and services for the petroleum refining, gas
processing, petrochemical, renewable energy and other industries. Performance Materials and Technologies' product portfolio includes fluorocarbons,
hydrofluoroolefins, caprolactam, resins, ammonium sulfate for fertilizer, phenol, specialty films, waxes, additives, advanced fibers, customized research
chemicals and intermediates, electronic materials and chemicals, catalysts, and adsorbents.
37